Loans data confirm very slow recovery in housing – is regulation constraining the sector?

The Housing Industry Association (HIA) gave an apt summary of today’s ABS housing finance data in the title of its media release Home lending up but not by enough. The Queensland data (see my chart below) are consistent with building approvals data (see this previous post) that suggest a very slow recovery for our building industry.

Loans
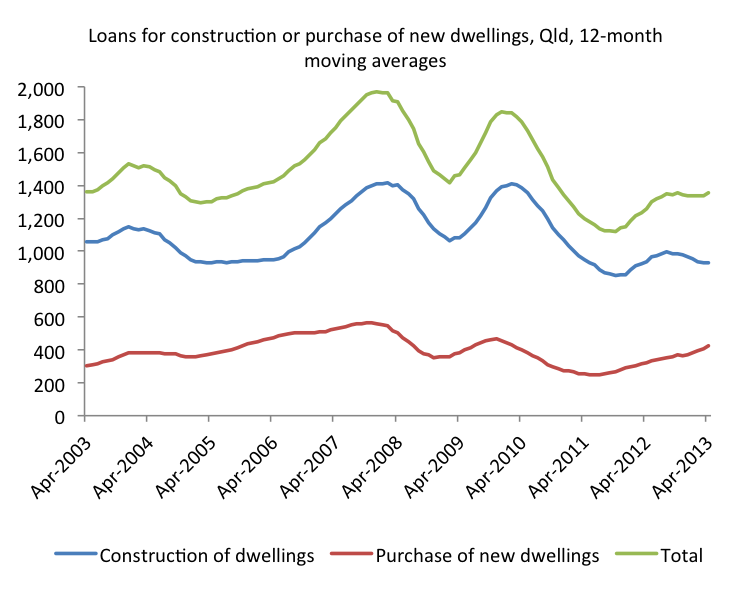
It is interesting that the proportion of new loans for the purchase of new dwellings, as distinct from the construction of dwellings, is increasing. Could this be because costs imposed by regulations (e.g. around environmental sustainability or heritage protection) are making building new houses in established areas even more unaffordable, leaving many people little choice but to buy more affordable houses in new estates on the urban fringe? The HIA certainly thinks regulation, along with taxation (stamp duty, I assume), is constraining housing construction. The media release notes:

“…residential investment in construction continues to languish near decade lows, a pointer to the disincentive to new home building attributable to excessive tax and regulatory costs,” warned HIA Senior Economist, Shane Garrett.

Given the very slow recovery in housing construction, our Councils and Governments need to have a serious look at the impact of their regulations and taxes on the sector.

On today’s housing finance data, KS at Loose Change notes there have been some widely varying interpretations:

How to interpret housing finance data?

As usual, MacroBusiness has good coverage of the data:

New home finance confirms ongoing tepid recovery


Posted in Housing | Tagged , , , , , | 4 Comments

Qld outback drought spreads – Mt Isa LGA now drought declared

Fourteen Queensland Local Government Areas (LGAs) covering 36 per cent of the State are now drought declared (see map below), with Mt Isa the latest addition (see Queensland Country Life coverage: Qld drought spreads). These LGAs account for around 12% of Queensland’s agricultural output, according to my calculations based on ABS data. As such, the macroeconomic impacts on the Queensland economy are likely to be small, but the situation warrants close monitoring. 

Drought declared LGAs

Posted in Agriculture | Tagged , , , , | Leave a comment

International tourism continues to recover, particularly in TNQ, thanks largely to Chinese visitors

Tourism and Events Queensland (TEQ) has released its latest International Tourism Snapshot, and it shows a solid recovery in international tourism in Queensland and nationally, particularly in Tropical North Queensland (TNQ), which includes Cairns and Cape York (see my chart below). With the Australian dollar falling recently, and with future declines possible, I expect international tourism will continue to recover.

Intlvisitors

The TEQ publication shows a large part of the increase in international tourism in TNQ is due to an influx of Chinese visitors (an annual growth of 40%). As discussed here before, many in TNQ are hoping Chinese tourism becomes as signficant in the region as Japanese tourism was in the past.

The other important economic news of the day was the slightly weaker than expected GDP figures. Queensland Treasury has nice information briefs on the data (National Accounts and State Details) and Pete Faulkner has a good summary (GDP slightly weaker).


Posted in Cairns, Macroeconomy, North Queensland, Tourism | Tagged , , , , , , , | 2 Comments

Senior public servants protected from job cuts

During his interview of Treasurer Tim Nicholls on 7.30 Queensland tonight, Matt Wordsworth cited new Queensland public service data showing job cuts were borne by workers earning less than $100,000 per year, and the number of public servants earning more than $100,000 has actually increased. Mr Wordsworth’s claim appears to be correct, based on figures from the Queensland Public Service Workforce Profiles for June 2012 and March 2013. I’ve charted the difference in public service full-time equivalent (FTE) employees between June 2012 and March 2013 for different salary groupings below.

ftes

Mr Wordsworth’s question will no doubt generate a lot of work tomorrow in public service agencies, which will have to explain to Ministers why they have protected senior public servants. Perhaps the inefficiencies did exist at the lower levels of the public service, but this will need to be explained. To some extent, the growth in numbers at the high end will reflect salary increases that may have already been agreed and which pushed some public servants into higher salary groupings.

Posted in Budget, Queensland Government | Tagged , , , | Leave a comment

Disasters have had huge budgetary impacts

The Queensland State Budget is out and it contains a clear analysis of the huge budgetary impact of natural disasters, particularly:

  • the large expenditure associated with disasters (e.g. around $2.5 billion to deal with ex-Tropical Cyclone Oswald’s impacts); and
  • the odd budgetary effects of the mismatch between the timing of Queensland’s expenditures on disaster recovery and the receipt of the Commonwealth’s contributions.

The Treasury has provided some interested figures showing what the Budget would look like if it were adjusted to exclude the impact of natural disasters, which I have presented in the chart below:

disasteradjustedFBSo we have much larger budget deficits due to the disasters in 2012-13 and 2013-14, but, oddly, the disasters mean the budget balance in 2014-15 and 2015-16 is better than it otherwise would have been, due to Queensland finally receiving delayed payments from the Commonwealth. Indeed, the Budget reports the projected underlying budget balance is actually a small deficit of $18 million in 2015-16 (see Table 1.5 on p. 10 of the Budget Strategy and Outlook), rather than a surplus of $1.065 billion.


Posted in Budget, Cyclones, Floods | Tagged , , , , , , | Leave a comment

Qld budget surplus delay not a big deal, but reinforces need to consider Energex & Ergon sell off

There won’t be much to report after the release of the Queensland Budget later today as it appears much of the big news has already been released, including a delay in achieving the Budget surplus, originally forecast for 2014-15 and now not expected until at least 2015-16 (see No cash to splash in Nicholls’ Budget).  In an interview on Friday, the second part of which aired this morning, Steve Austin from 612 ABC Brisbane asked me about whether we should worry about the delay in achieving the surplus. While I’m waiting for the link to the interview to come up, I recall making the following points:

  • it’s difficult for governments to give iron-clad commitments to surpluses in particular years (and they will be reluctant to in the future), because so much depends on prevailing economic conditions (e.g. GDP growth, coal price, etc), and
  • we really need to reform the GST to give State Governments a larger guaranteed and more predictable revenue source, as I’ve previously observed (Government has to rely on inefficient taxes to fix budget – GST reform needed).

I would also add that the delay in achieving a Budget surplus reinforces the need to consider selling off Energex and Ergon, so we can pay down our debt quicker, get our AAA rating back, and reduce our borrowing costs, as I’ve previously commented:

Commission of Audit report an impressive guide to reform of Qld Government

Govt should embrace Costello Commission of Audit privatisation recommendations

Link to my interview on Commission of Audit on ABC Brisbane radio this morning

Posted in Budget | Tagged , , , , , , | 1 Comment

Brisbane ABC radio interview from this morning – why is budget forecasting so difficult?

Steve Austin of 612 ABC Brisbane asked me an interesting question this morning: why is budget forecasting so difficult for Treasury departments? You can listen to my answer at this link:

The Upcoming Budget

For further information on the challenges facing economic forecasters, I recommend the excellent review of Commonwealth Treasury macroeconomic and revenue forecasting completed in December 2012.

Posted in Budget, Tax | Tagged , , , , , | Leave a comment

Qld defies national trend in capital spending – Qld resources sector investment hasn’t peaked yet

Consistent with yesterday’s data on construction activity (see my post from this morning), ABS data released today show private sector capital spending in Queensland has not yet fallen from a peak, as national capital spending has due to a drop in WA mining capital expenditure (see chart below). So it’s possible Queensland resources sector investment hasn’t peaked yet, although it may sometime this year.

capexAs usual, MacroBusiness has a good summary of today’s data:

Actual capital expenditures fall sharply on mining

And Pete Faulkner makes some interesting observations at his blog:

CAPEX data shows no sign of a mining investment cliff

In other economic news today, ABS building approvals data remain uninspiring:

buildingapprovals


Posted in Housing, Mining | Tagged , , , , , , | Leave a comment

Resources sector investment hasn’t peaked yet in Qld – we now lead Australia in construction

Unlike the rest of Australia, construction activity increased in Queensland in the March quarter. This was due to heavy, so-called engineering construction, no doubt resources sector-related, as residential and non-residential building activity (i.e. houses, flats, office buildings, shopping centres, etc) continues to languish (see chart below based on yesterday’s ABS data).

Construction

Queensland is now ahead of WA in engineering construction, most likely because of the massive capital investment associated with building the LNG plants up at Gladstone (see chart below).

EngineeringIn fact, as MacroBusiness’s useful State comparison chart shows, Queensland now leads Australia in total construction activity (see Mining investment has peaked).


Posted in Housing, Mining | Tagged , , , , , , , , | 2 Comments

Did the financial crisis lead to an increase in Queensland’s crime rate?

Under its open data policy, the Queensland Government yesterday released a very interesting data set on criminal offences on a monthly basis since July 1997. Recalling the work of Nobel laureate Gary Becker on the economic determinants of crime, I prepared this quick chart to see if Queensland’s higher unemployment rate since the 2008 financial crisis has affected the crime rate (offences per 100,000 people). I restricted the analysis to robbery, unlawful entry with intent, unlawful use of a motor vehicle and other theft because I considered these offences to be the ones most likely influenced by economic conditions. I’ve labelled these offences robbery, burglary and theft on the chart below.

crimeEyeballing the data, it’s possible higher unemployment has led to a slight pick up in crime since the financial crisis. Of course, it would be desirable to undertake a more rigorous statistical analysis. This analysis would need to account for demographic change, particularly the falling population share of young people, who commit a disproportionate number of offences. I hope some keen researcher out there picks up this fascinating new data set.

Posted in Crime, Labour market | Tagged , , | 2 Comments