NAB Chief Economist Alan Oster had a memorable quote regarding the latest NAB Business Survey results published in The Australian yesterday:
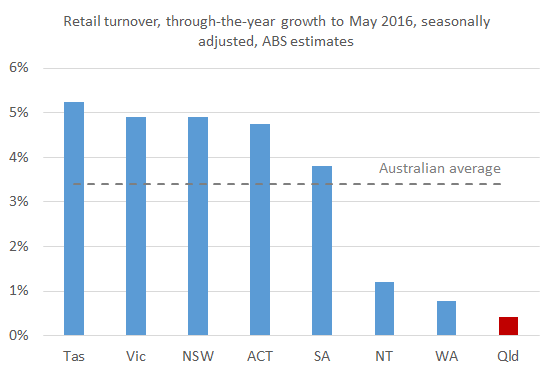
“West Australia is going backwards, South Australia is in no great shakes and Northern Queensland is just as bad, but the eastern seaboard, from southeast Queensland through NSW and Victoria, are shooting the lights out.”
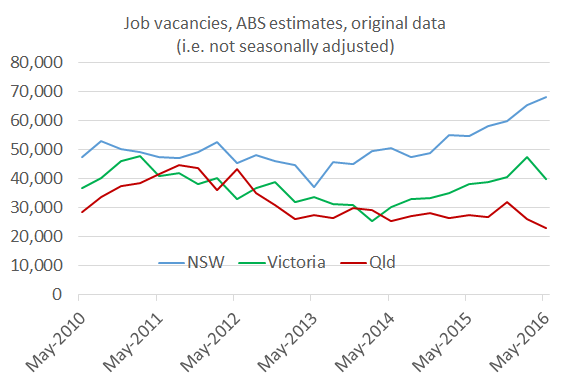
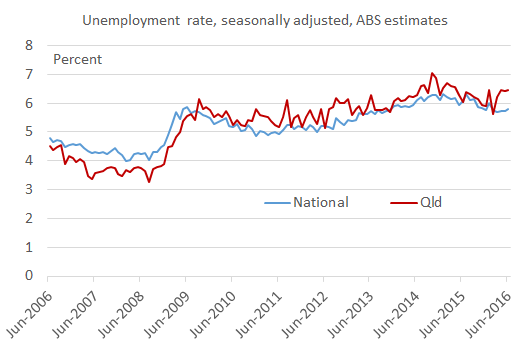
Oster has correctly identified the divergence in economic performance between SEQ and regional Queensland. This divergence means it is difficult to characterise how the total Queensland economy is performing. The ongoing economic weakness in regional Queensland has contributed to the Queensland unemployment rate increasing slightly to 6.5 percent in June, up from 6.4 percent in May (see chart below and Queensland Treasury’s Labour force brief). This is much higher than pre-financial crisis lows, but is much lower than historical double-digit highs, last seen in the early 1990s when the unemployment rate reached 10-11 percent. That said, the Queensland outback had a double-digit unemployment rate in May of nearly 12 percent and Townsville had an unemployment rate over 9 percent, according to Queensland Treasury’s smoothed estimates of the ABS original data (see Treasury’s Regional Labour Force brief).
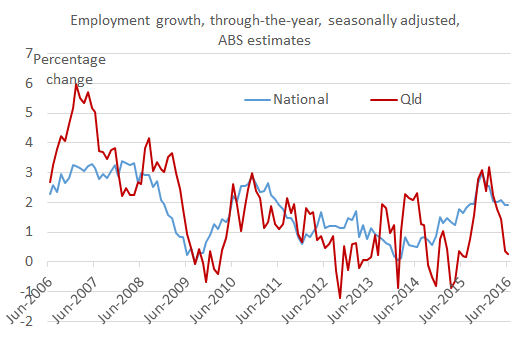
While SEQ appears to be performing reasonably well, it is obvious that jobs growth in SEQ is being offset to a large extent by job losses in regional Queensland, producing a relatively low rate of employment growth of only 0.3 percent over the year to June, compared with 1.9 percent nationally (see chart below).
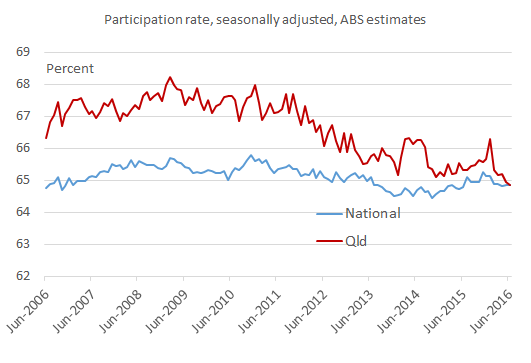
As I have commented previously, Queensland’s under-performing economy may have discouraged many people from looking for work, resulting in a reduction in the labour force participation rate (see chart below). Indeed, our participation rate has converged to the national rate (now 64.9 percent), while historically Queensland had a significantly higher participation rate.
On the June labour force data released by the ABS today, also see Pete Faulkner’s post:
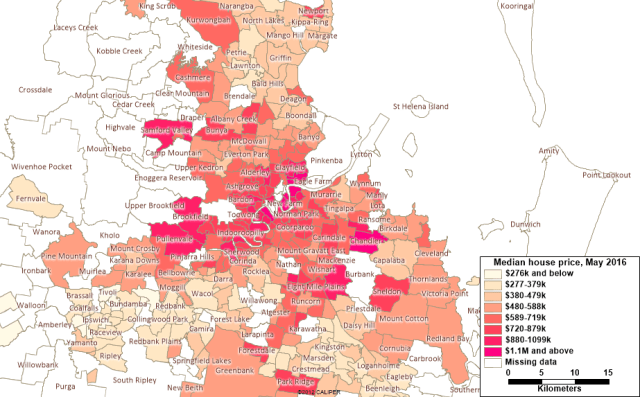 Source: CoreLogic May 2016 median house price data published in the August issue of Your Investment Property magazine. N.B. data unavailable for some suburbs (coloured white on map).