
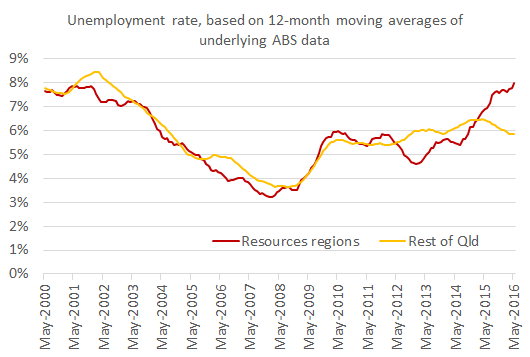
The Queensland branch of the Economic Society of Australia, of which I am the Secretary, was fortunate last Tuesday to host a presentation by Queensland Treasury official Greg Uptin on the economic forecasts underpinning the 2016-17 Queensland Budget. Greg gave a very interesting and highly informative presentation, full of terrific charts. One of my favourite charts compared the unemployment rate for the resources regions—Fitzroy, Mackay, Queensland outback and Townsville regions—with the unemployment rate for the rest of Queensland (see my reproduction of it below, based on the latest ABS regional labour force data released last Thursday). This clearly illustrates just how diverse economic conditions are across Queensland, and how much the regions have suffered from the mining downturn and drought.
Well done to Greg and his Queensland Treasury team for preparing such an excellent presentation.
On the latest ABS regional labour force data, also see Pete Faulkner’s post:
Both Cairns and Townsville see labour markets deteriorating in May
