Hotels appear to have doubts about prospects for tourism recovery

Although there has been some recovery in room occupancy rates at hotels, motels and serviced apartments since the financial crisis (see first chart below), establishments are maintaining their financial crisis levels of staffing (see second chart below), which must impact on the visitor experience somewhat and suggests hotels remain anxious about the future.

ror


averageemployees
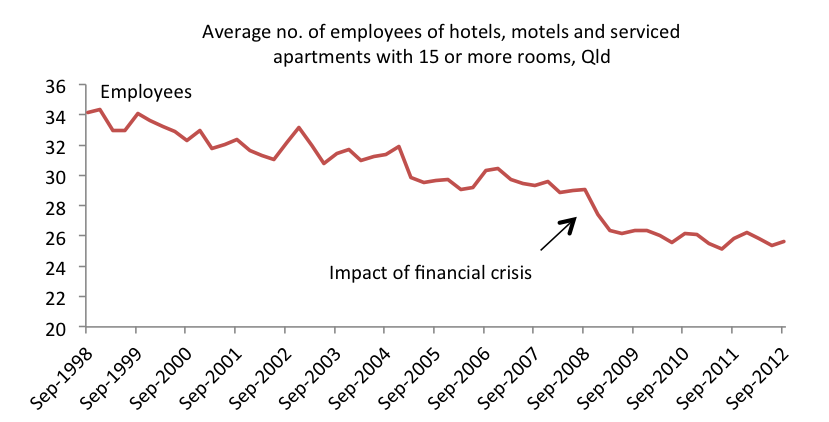
Of course, I’m assuming the drop in employment per establishment that occurred in 2008 was due to the financial crisis and wasn’t simply a continuation of the downward trend in employees per establishment over the previous decade, which must have been related to IT adoption and outsourcing. Given the sharpness of the drop in average employee levels in 2008, I’m reasonably confident it was related to the financial crisis rather than a continuation of the downward trend.

The relevant data were released by the ABS last Friday (Tourist Accommodation, Australia).

Posted in Tourism | Tagged , , , , , , , , | 1 Comment

When will interstate migration to Qld recover?

Over the last few years, a decline in Queensland’s population growth has reinforced the economic sluggishness we’ve seen outside of the mining sector. For example, lower population growth means lower demand for new housing. In large part, Queensland’s lower population growth is due to a sharp decline in net interstate migration (see chart below, based on ABS demographics data released in the week before Christmas). Net interstate migration is the difference between people moving to Queensland from interstate (i.e. arrivals) and people moving out of Queensland to other States (i.e. departures).

Popchange

Continue reading

Posted in Migration, Population | Tagged , , , , | 1 Comment

Doubling of FIFO/DIDO workers in Surat Basin in 2012

I just noticed that the Government Statistician/OESR released the 2012 Surat Basin Population Report yesterday and it shows a 97% increase in fly in-fly out (FIFO) and drive in-drive out (DIDO) workers in the Surat Basin between June 2011 and June 2012 (see chart below).fifo

Posted in Labour market, Mining | Tagged , , , , , , , , , , | Leave a comment

Japanese tourism revival may be unlikely given demographic trends

I noticed a report in the Cairns Post this morning regarding an initiative aimed at reviving Japanese tourism to Far North Queensland:

THE tourism industry is pinning its hopes on a new joint Australia and Japan tourism campaign to return Japanese numbers to 200,000 or more by the year 2015.

The Australia-Japan Tourism Exchange Year 2013 also is intended to encourage Far North Queenslanders to travel to the Land of the Rising Sun on the direct flights operated by Jetstar between Cairns, Osaka and Tokyo.

Tourism Tropical North Queensland chief executive officer Rob Giason said the region was continuing to rebuild the market with an Australian holiday market share of 39 per cent of Japanese visitors to Australia….

…To the year ended September 2012, 91,000 Japanese tourists had visited the region, the same as the previous year.

I think it’s unlikely we’ll ever see Japanese tourism numbers back to where they once were, given population ageing and the projected decline in the Japanese population over coming decades, as highlighted in the UN population projections below (available at this link):

JapanpopLuckily for our tourism industry, however, Chinese tourism is growing strongly. For example, see this post of mine from October:

Positive outlook for Far North tourism with direct flights from China about to commence


Posted in Cairns, Tourism | Tagged , , , , , , , , | 3 Comments

Large disparity in unemployment rates across Brisbane suburbs

An important policy debate in 2012 was around the level of unemployment benefits, with welfare groups such as ACOSS arguing people on Newstart could be too poor to look for work (as reported on news.com.au). I have some sympathy for this position because many unemployed people are disadvantaged by living in outer suburbs and would have to pay more in transport costs in looking for work than people in inner city suburbs. Further, they are disadvantaged by having much less accessible and available public transport than people in the inner city.

There is a clear disparity in unemployment rates across the Brisbane metropolitan area, with very low unemployment in the leafy Western suburbs, but with clusters of unemployed people on the Northern, Southern and Western outskirts of Brisbane, particularly in Caboolture, Inala, Woodridge and Kingston. While I think there is a risk of discouraging job search efforts if unemployment benefits are increased signficantly, I think there is a strong case for investing in better public transport for outer-lying areas with high unemployment.

Brisbane small area unemployment rates, September 2012

BrisbaneThe map of unemployment rates above is based on September quarter 2012 small area labour market estimates produced by the Commonwealth Department of Education, Employment and Workplace Relations (DEEWR). Basically, DEEWR produces a best guess of small area unemployment rates based on ABS labour market data for bigger areas (e.g. Brisbane Inner City) and recent Centrelink data on unemployment benefit recipients.

There appears to be less of a disparity in unemployment across the suburbs of other Queensland cities, such as Townsville (first chart below) and Cairns (second chart below), where every small area appears to suffer high unemployment except for the Northern suburbs.

Townsville small area unemployment rates, September 2012

Townsville

Cairns small area unemployment rates, September 2012

Cairns


Posted in Brisbane, Cairns, Labour market, Townsville | Tagged , , , , , , | 2 Comments

When will Queensland get its AAA credit rating back?

I’m unsurprised by Wayne Swan’s announcement the surplus is unachievable – it always was, even when the outlook was better, as I posted on previously (Budget turnaround looks implausible in Treasurer’s chart). Also the Queensland budget update today contained no surprises, and the slight downgrade to the economic outlook was expected given recent sluggishness in the labour market and reductions in coal prices. This slight downgrade in the outlook has no real impact on the fiscal repair task over the next few years, as shown in the important debt-to-revenue ratio chart (reproduced below) from the update. Incidentally, reflecting on this chart, it’s going to take the Government a long time – possibly not until 2020 or after – to get the debt-to-revenue ratio down to 100%, which is where we really need it to be to convince the ratings agencies to give us our AAA credit rating back. Treasury will need to keep up the pressure for fiscal restraint in the years to come.

debttorevenue

Posted in Budget | Tagged , , , , , , | 1 Comment

Queenslanders less active than other Australians – no surprise we lead Australia in obesity

I’ve previously posted on the higher rate of obesity in Queensland than in other States (Qld leads Australia on obesity), and no doubt a major contributor is the lower rate of participation in sport and physical recreation in Queensland than in other States. See the charts below for male and female participation rates in sport and physical recreation based on the most recent ABS data released today:

males

females

Obesity places a large and increasing cost on our health system and it may be cost-effective to encourage greater physical activity through investments in bike paths and public transport that people can walk to, noting the benefits from accessible public transport I mentioned in this previous post:

Cross River Rail or a Brisbane Metro?

Posted in Health | Tagged , , , , | 2 Comments

Qld still has second highest population growth rate in Australia

OESR has published a useful information brief on today’s new ABS population data, from which I’ve copied the chart below showing Queensland is still performing reasonably well in population growth terms.

popgrowth

The ABS media release on the data is worth a read. It notes the baby boomers are starting to turn 65. Undoubtedly the movement of the large baby boomer cohort into old age will have signficant implications for our workforce and industry mix over the coming decades.


Posted in Population | Tagged , , , , | Leave a comment

Gold Coast holiday bookings confirm domestic tourism recovery

There is some good news for our tourism sector reported in the Gold Coast Bulletin this morning, and I expect the news will be similar at other holiday destinations across Queensland (Occupancy up at Gold Coast hotels):

MANY Gold Coast hotels are booked out over the summer holidays with domestic travellers flooding back to the city in numbers not seen since before the global financial crisis.

Mantra Group, which runs 20 Peppers, Manta and Breakfree properties on the Gold Coast said occupancy was up eight per cent overall, but that Peppers Broadbeach had a staggering 52 per cent increase in bookings compared with last year.

The Gold Coast’s resurgence is backed by Tourism Australia research, which shows the constant decline in domestic tourists over the past four years has finally turned around.

I posted on the Tourism Research Australia data showing a recovery in domestic tourism last week:

Domestic tourism continues to recover in Qld

Other recent and relevant posts include:

Tourism recovering at slower rate in Qld than in rest of Australia

Qld should look to Victoria for tips on tourism promotion

Posted in Gold Coast, Tourism | Tagged , , , , | 1 Comment

Impressive start to Qld Govt data disclosure – check out Dept of Communities grants data

The news.com.au article Queensland Police are zeroing in on crime, and a planned street map of offences will be just a click away alerted me to the Queensland Government data website, which, while incomplete, represents an impressive start to making the huge amount of data captured by the Queensland Government publicly available. I’m very impressed by the availability of data on levels of grant funding provided by the Communities Department to around 2,300 organisations in 2011-12, which is available at Grants funding paid to organisations. I’ve produced a chart (see below) of the funding levels for the top 20 recipients, which receive around 45% of all funding. There is a massive variance in funding levels among organisations, with the top 20% (458 out of 2,291 organisations) receiving over 90% of total funding.

Top20I’ve previously posted on the Government’s commitment to open information:

Commitment to open information commendable

Posted in Housing, Queensland Government | Tagged , , , , | Leave a comment