
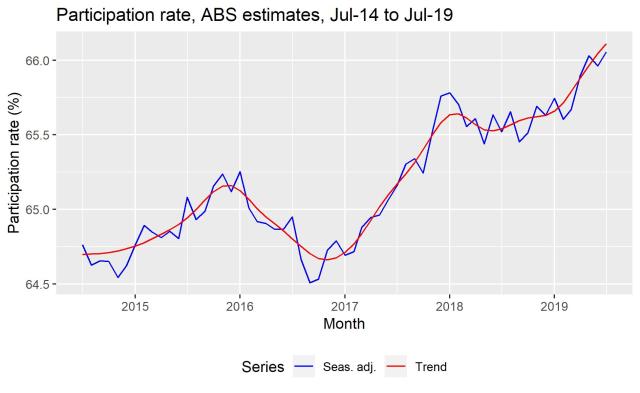
The first episode of the new season of Utopia on the ABC featured the Intergenerational Report, which projects an eventual reduction in the workforce participation rate due to an ageing population. At the moment, however, Australia’s participation rate is actually at a record high of 66.1% (see chart below). Why is this so?
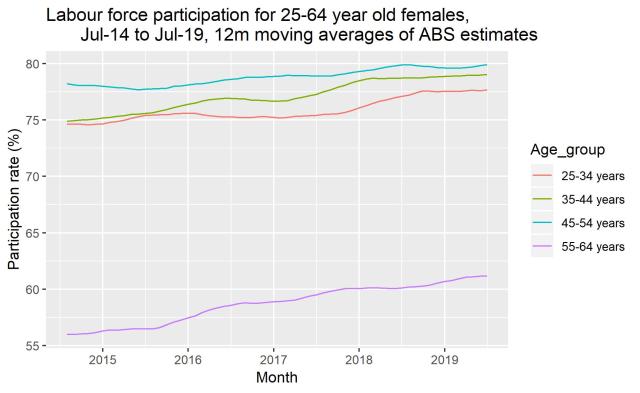
Arithmetically, the increase in the labour force participation rate for people aged 15 and over in recent years is a result largely of increases in participation rates among women across all age groups (e.g. see chart below). Older women are staying in the workforce for longer, and younger women are having fewer children and less time out of the workforce, as suggested by the declining fertility rate (see ABS estimates of the total fertility rate). The strong jobs growth Australia has experienced in recent years may have played a role, too, by encouraging additional people to seek work, the so-called encouraged worker effect.
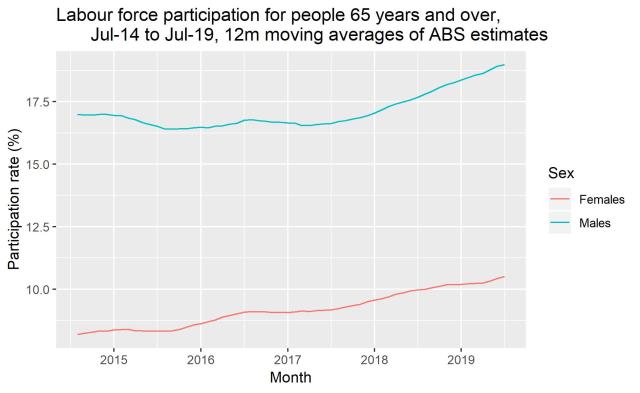
The participation rate for females aged 65 and over (and males aged 65 and over) has increased significantly, too (see chart below).
The national participation rate is a weighted average of the participation rates for different age groups, where the weights are the shares of each age group in the total population aged 15 and over. So the participation rate can change either because participation rates for particular age groups change, or because the age structure of the population changes. Over time, both these things can occur, as we have seen over the last five years in Australia (Table 1).
Table 1. Participation rates and population shares by age group, Australia, calculated using 12 month moving averages of ABS Original estimates
| Sex | Age group | Participation rate (%), Jul-14 | Participation rate (%), Jul-19 | Pop. Share (%), Jul-14 | Pop. Share (%), Jul-19 |
| Females | 15-19 | 55.5 | 56.7 | 3.8 | 3.6 |
| Females | 20-24 | 75.8 | 77.2 | 4.3 | 4.2 |
| Females | 25-34 | 74.6 | 77.7 | 9.0 | 9.3 |
| Females | 35-44 | 74.7 | 79.0 | 8.6 | 8.2 |
| Females | 45-54 | 78.3 | 79.9 | 8.3 | 8.0 |
| Females | 55-64 | 55.9 | 61.2 | 7.2 | 7.3 |
| Females | 65+ | 8.1 | 10.5 | 9.6 | 10.4 |
| Males | 15-19 | 50.9 | 53.2 | 4.0 | 3.8 |
| Males | 20-24 | 80.8 | 81.3 | 4.4 | 4.4 |
| Males | 25-34 | 90.7 | 91.3 | 9.0 | 9.1 |
| Males | 35-44 | 91.1 | 91.9 | 8.4 | 8.1 |
| Males | 45-54 | 87.9 | 88.3 | 8.1 | 7.7 |
| Males | 55-64 | 72.1 | 73.0 | 6.9 | 7.0 |
| Males | 65+ | 16.9 | 19.0 | 8.4 | 9.1 |
| Persons | Total | 64.7 | 65.8 | 100.0 | 100.0 |
For many years now, we have expected the increasing share of the population in older age groups will result in a falling participation rate. That will eventually occur, probably sometime next decade, but, to date, rising age-specific participation rates, and to a lesser extent, a 25-34 year old population which has increased its share of the total population, probably due to immigration, have prevented this from happening.
The contributions of changes in participation rates by age group and changes in the age structure of the population to the change in the overall participation rate can be calculated (see table below).* I call the impact of changing age-specific participation rates the rate effect, and the impact of a changing age structure the composition effect.
Table 2. Percentage point contributions to change in participation rate over Jul-14 to Jul-19, based on 12 month moving averages of ABS Original estimates
| Sex | Age group | Rate effect | Composition effect | Interaction | Contribution to difference |
| Females | 15-19 | 0.05 | -0.13 | 0.00 | -0.08 |
| Females | 20-24 | 0.06 | -0.09 | 0.00 | -0.03 |
| Females | 25-34 | 0.28 | 0.17 | 0.01 | 0.45 |
| Females | 35-44 | 0.37 | -0.25 | -0.01 | 0.11 |
| Females | 45-54 | 0.13 | -0.23 | 0.00 | -0.11 |
| Females | 55-64 | 0.38 | 0.08 | 0.01 | 0.47 |
| Females | 65+ | 0.24 | 0.06 | 0.02 | 0.31 |
| Males | 15-19 | 0.09 | -0.12 | -0.01 | -0.03 |
| Males | 20-24 | 0.03 | -0.05 | 0.00 | -0.02 |
| Males | 25-34 | 0.06 | 0.07 | 0.00 | 0.13 |
| Males | 35-44 | 0.07 | -0.27 | 0.00 | -0.20 |
| Males | 45-54 | 0.03 | -0.35 | 0.00 | -0.33 |
| Males | 55-64 | 0.06 | 0.01 | 0.00 | 0.07 |
| Males | 65+ | 0.17 | 0.13 | 0.02 | 0.32 |
| Persons | Total | 2.01 | -0.97 | 0.02 | 1.06 |
In combination, the positive rate effect and the negative composition effect explain the bulk of the change in the participation rate of 1.06 percentage points over Jul-14 to Jul-19. Rising age-specific participation rates would have pushed the participation rate up 2 percentage points, if it were not for the changing composition of the population, which counteracted this increase by 1 percentage point, so the overall increase was only around 1 percentage point. There is a small, second-order interaction, which is that part of the change that cannot be attributed solely to changing participation rates or population shares.
Note that as the data needed to undertake this type of analysis are not seasonally adjusted, I have used twelve-month ABS Original estimates. This explains the discrepancy between the participation rate figures in Table 2 and the values in the first chart in this article.
*The contribution of changing age-specific participation rates to a change in the total participation rate (the rate effect) can be estimated by calculating the national participation rate using current age-specific participation rates and base period age-specific population shares. The base period is July 2014 in these calculations. The contribution of a changing age structure (the composition effect) is estimated by calculating the national participation rate using the latest age structure but with the base period age-specific participation rates.

I have never accepted the argument that an ageing population would result in older workers just walking away to play lawn bowls for a few years before death as they did in the past.
“For many years now, we have expected the increasing share of the population in older age groups will result in a falling participation rate.” Can you provide a source reference for this?
The Intergenerational Report has been projecting this ever since its first edition in 2002…
https://treasury.gov.au/publication/2002-igr
Back in 2002 we were expecting the participation rate to fall to the low sixties by now. Thanks for the comment and question.