
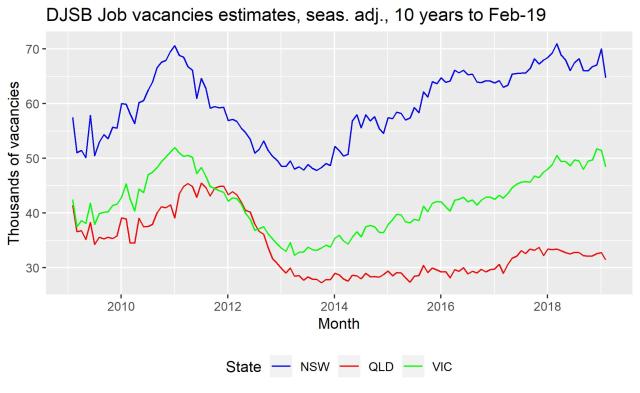
The federal Department of Jobs and Small Business published its February 2019 internet job vacancies data last week, and it revealed a continuation of the downward trend in job vacancies, which were 5.5% lower in Queensland and 4.0% lower nationally than the year before (see the chart below). This appears consistent with the downswing in the economy I suspect is now occurring.
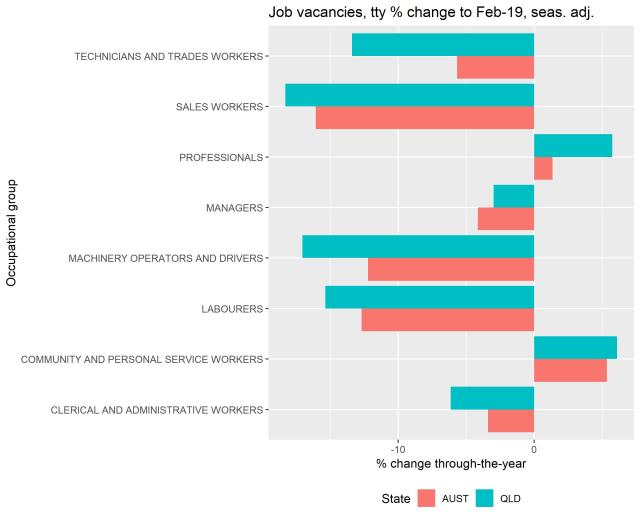
The fall in vacancies was experienced across most occupational groups, with the exception of professionals, largely in health and education, and community and personal service workers (e.g. carers and aides), most likely due to the NDIS.
Also, consistent with the story of an economic downswing, nationally and potentially internationally, too, are the reports that Hundreds of Queensland retailers are at risk of collapse and that the yield curve for US Treasury bills and bonds has inverted for the first time since 2007, which was the year of the sub-prime crisis and the start of the panic which culminated in the global financial crisis in late 2008. As the Financial Times reported last Friday:
…the difference between two- and 10-year yields dipped below 10 basis points for the first time this year. This is the primary indicator that investors watch because it has inverted — where short-dated yield rise above longer-dated yields — before every recession since the second world war.
As noted in the Financial Times article, an inverted yield curve is not a perfect predictor of a coming recession, but it certainly did spook financial markets when it occurred.
I should note Queensland did have a surprisingly good result in the ABS labour force figures for February, which were published last Thursday, with the seasonally adjusted rate falling to 5.4% and the trend rate to 5.7% (see the Qld Treasury briefing). This was due largely to a fall in labour force participation, however, so I’m not getting too excited about it. Given our relatively younger population, it seems very odd that Queensland’s participation rate is now at 65% compared with the national average of 65.6%. The peculiar data may be related to a change in the composition of the ABS’s sample of Queensland households. Indeed, we know the ABS had difficulty getting data from its Townsville households due to the floods, as noted on the ABS website and in Pete Faulkner’s post, raising questions about the reliability of the data. So we need to wait and see whether the Queensland unemployment rate stays at this lower level. As always, we need to be cautious in interpreting month-to-month changes in the labour force data.
Finally, as I’ve noted before, I undertake my data analysis and charting using R, the data science programming language, which I can’t recommend highly enough. I’m trying to convert others to using R and am running an upcoming course which I discuss in this new video:
Here is the link to the Eventbrite page for the course:
Data science with R: Introduction with a focus on ABS economic data

Hi Gene. An obvious observation is that you can certainly see the end of the mining boom in 2012 and even though mining is a lot more solid now it does not have the same jobs pick up. The community and service workers being the major real positive is ok as long as the sectors that actually make the income recover so that we can pay these people.
Yes, very good points. Thanks for the comment Russell.