Professionals’ share of employment much lower in Qld than in southern states

Regular reader Mike Willis made an excellent comment regarding my previous post breaking down the difference between Queensland’s unemployment rate and the rate for the rest of Australia, with Mike observing:

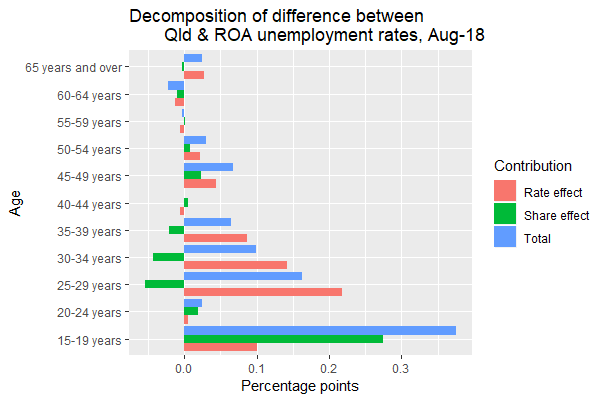
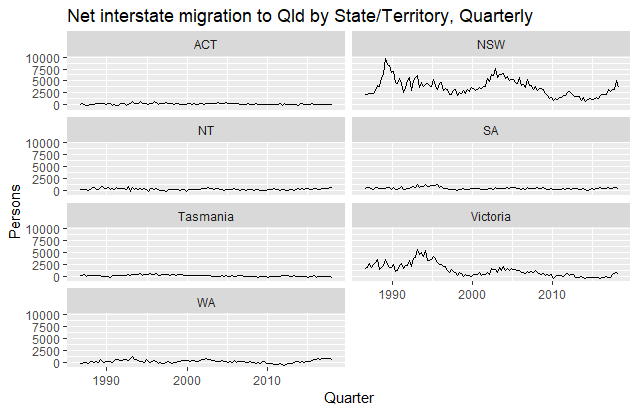
Am I correct in guessing that the relative deficit of 25-40 yo [year old] workers (the negative green “share effects” in these ages in your third graph) is related to the “brain drain” effect? IE: that tertiary qualified workers have to move interstate to find attractive work that suits their qualifications?

If my guess is correct, then that is the scariest observation in your data! The Queensland economy needs to find attractive value-adding enterprises to attract and retain that bright generation.

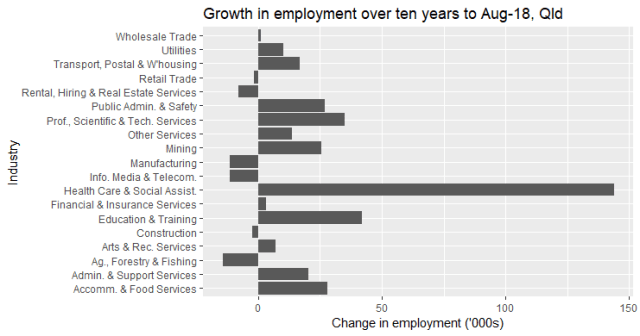
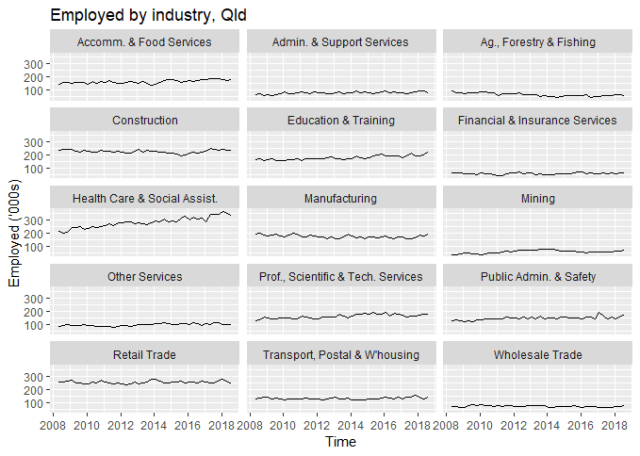
There is much truth in Mike’s observation.  As I noted in the post, the jobs market for professionals has been relatively weak in Queensland in recent years. Indeed, Queensland Treasury’s occupational employment briefing for September quarter reported a 0.4% decline in employed persons classified as professionals compared with 3.4% growth nationwide through-the-year.

ABS Labour Force Survey data reveal Queensland has a much lower share of its workforce in professional jobs than other states. Professionals account for just over 20% of all employed persons in Queensland, compared with 26% in NSW and 25% in Victoria. That is, one-in-four employed persons in southern states is a professional, compared with only one-in-five in Queensland. See the facet plot below of the occupational shares of total employment by state/territory for September quarter 2018. The data are based on four-quarter moving averages of the original ABS data.

Rplot_occ_shares

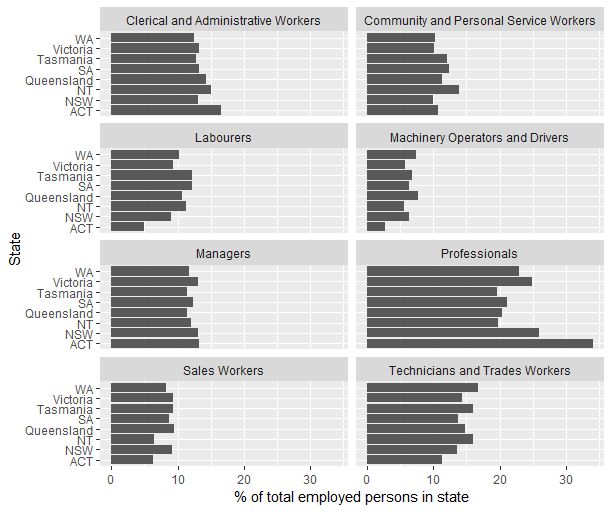
The facet plot also shows Queensland leads the states (i.e. not including the territories) in clerical and administrative workers, which is no doubt related to our bloated state public service.

Finally, I should note I agree with Mike that Queensland’s economy “needs to find attractive value-adding enterprises”. The best way to do this would be to set taxes and regulations on all businesses as light as possible, rather than by continuing the futile approach of providing special payroll tax holidays and other incentives to the favoured few fashionable businesses and international film productions. Special deals for the favoured few mean other businesses and households have to pay higher taxes than otherwise. For my previous comments on the futility, inefficiency, and unfairness of this type of industry assistance see:

Is Scottish Superstar BrewDog’s Arrival Good for Brisbane’s Brewing Scene?

4BC Dora the Explorer interview

Ragnarok in Brissywood

Posted in Industry policy, Labour market, Uncategorized | Tagged , , , , , , , , , , , | 4 Comments

Unemployment rates in Qld and rest of Australia: breaking down the contributions of different age groups

Higher unemployment among young Queenslanders than their peers in southern states, as well as a higher proportion of 15-19 year olds in the labour force, account for a large part of the difference between Queensland’s unemployment rate, stuck at just over 6%, and the rate in the rest of Australia, which is approaching 5%.

First, consider the significantly higher unemployment rates for younger age groups in Queensland than in the rest of Australia, except for the 20-24 year old age group (see chart below, based on 12-month moving averages of ABS original data). The transition from education to work appears equally difficult for 20-24 year olds across Australia, but, for people aged 25 to 39, unemployment rates are significantly higher in Queensland. This could reflect a relatively weaker professional jobs market in Queensland than in other states in recent years.

urate_age_group_Qld_ROA

Second, consider that Queensland has a larger share of its labour force (i.e. employed and unemployed persons) coming from the 15-19 year age group than does the rest of Australia (see chart below). To an extent, this is related to Queensland not having had a compulsory prep year until very recently, and therefore having a higher proportion of the 15-19 year old cohort looking for work than the rest of Australia. Having a larger share of its labour force in the 15-19 year age group partly explains Queensland having a higher unemployment rate than the rest of Australia, because the 15-19 year old age group typically has a high unemployment rate, well above the average of other age groups.

LF_shares_age_QLD_ROA

But how much of Queensland’s higher unemployment rate is due to having more 15-19 year olds in the labour force, and how much is due to different age groups having higher unemployment rates than their peers in other states? This is relatively straightforward to estimate, given the overall unemployment rate can be expressed as a weighted average of age-specific unemployment rates (i.e. the data in the first chart), where the weights applied are the age-specific shares of the total labour force (i.e. the data in the second chart).

The 0.8 percentage point difference between Queensland’s unemployment rate (at 6.1% in August) and that of the rest of Australia (5.3% in August) can be decomposed into what I’ll call a rate effect and a share effect.* The rate effect measures the impact of Queensland having different age-specific unemployment rates than in other states, while the share effect measures the impact of the different age composition of Queensland’s labour force on the unemployment rate. These effects can be calculated for all the different age groups (see chart below), and then aggregated to determine the overall impacts.

Decomposition_Qld_ROA

Overall, aggregating across the age groups, Queensland’s 0.8 percentage point higher unemployment rate can be approximately decomposed into:

  • 0.6 percentage points related to higher age-specific unemployment rates (the rate effect), largely associated with age groups under 40; and
  • 0.2 percentage points related to Queensland’s labour force having a different age composition, with proportionately more 15-19 year olds, an age group which typically has a high unemployment rate.

So Queensland’s higher unemployment rate is only partly explained by the state having a different age composition of its labour force, and I expect this age composition impact will decline in future years as a result of the prep year introduced in 2007 and made compulsory in 2017. Queensland’s higher-than-national-average unemployment rate is mostly related to our relative economic under-performance in recent years.

*Technical note: economists generally label the technique I’m using as shift-share analysis. The estimates in this post are based on ABS labour force data up to August. As noted above, the original (i.e. not seasonally adjusted nor trended) data published by the ABS were smoothed using a 12-month moving average. The September data will be published by the ABS on Thursday, but I don’t expect the story to change significantly.

Posted in Labour market, Uncategorized | Tagged , , , , , , | 2 Comments

National jobless rate may be lowest in 7 years, but Qld’s is ½ percentage pt higher than in 2011-12

The Australian’s Friday front page was emailed out earlier tonight, and it reports “Jobless rate at lowest in seven years.” This may be the case for Australia, but it’s not so for Queensland, where the unemployment rate is stuck around 6%, as it has been for a few years now (see chart below). Seven years ago the state unemployment rate was 5.5%. So, while the Australian unemployment rate is back around to what it was seven years ago, Queensland’s is ½ percentage point higher. That corresponds to around 15,000 more unemployed people in Queensland than we would have if we’d returned to the 2011-12 unemployment rate. As I’ve noted before, the Queensland economy is under-performing relative to the southern states.

lfs_sep18_chart1

With a 6.1% unemployment rate, Queensland is tied with WA in terms of having the highest unemployment rate among states and territories (see chart below). NSW has an unemployment rate of 4.5% and Victoria has a rate of 4.7%.

lfs_sep18_chart2

While Queensland experienced strong jobs growth in 2017, since then jobs growth has fallen substantially (see chart below).

lfs_sep18_chart4

Note that many of the new jobs that have been created in recent years have gone to new entrants or re-entrants to the labour market, rather than to the unemployed. The number of unemployed Queenslanders has remained relatively stable (see chart below).

lfs_sep18_chart5

We need to see much stronger employment growth in Queensland than over the last 12 months if we are going to see a material reduction in the state unemployment rate. Consider that Queensland’s 15+ population is increasing by around 70,000 persons each year (see chart below). The employment-to-population ratio is around 62%, meaning the Queensland economy needs to support more than 43,000 additional employed persons each year. Over the 12 months to September, employment increased in Queensland by just over 39,000, so it was several thousand short of the minimum required to stabilise the unemployment rate. So it’s unsurprising that, as Queensland Treasury noted in its latest labour force briefing, the state’s trend unemployment rate was “marginally higher over the year”, at 6.1% compared with 6.0% in September 2017.

lfs_sep18_chart6

Posted in Labour market, Uncategorized | Tagged , , , , | Leave a comment

Qld “gets its mojo back” on international visitors

STarrivals_plot_1

Mission Beach-based economist Pete Faulkner has great coverage of the latest international short-term arrivals and departures data for August from the ABS in his latest post:

International arrivals still growing; QLD gets its mojo back while Tassie slows

As Pete notes, while the resurgence has been impressive (see the chart array above), we still lag Victoria:

When we consider the data on state of intended stay (which we Trend based on the unadjusted original ABS data) we see that year on year growth for Queensland is at its fastest pace in more than 2 years (+10.4%) while it’s up 6.8% for the annual total. Growth in the Sunshine State continues to lag that in Victoria (+11.3% y/y and +7.9% annual) as the gap between the two states widens further.

Given international visitor numbers to southern states are still growing strongly, we’re not seeing much of a recovery in Queensland’s share of total international short-term arrivals, although at least it has stabilised and no longer appears to be declining (see the chart array below).

STarrivals_plot_2

Note that short-term arrivals are defined as those staying for one year or less, meaning many students would be included. It’s very likely international students explain a large part of the surge in short-term arrivals in southern states. Also, it should be borne in mind that, even though short-term visitors may nominate one state as where they intend to stay on their passenger cards, many do of course visit other states, so we shouldn’t get too despondent about Queensland’s share of total arrivals.

Regarding country-of-origin, data for which are only available at the national level, as Pete observes in his post:

The growth from the Chinese market has continued to slow sharply (although it’s still growing) and is up 2.3% y/y (s.a.) or 2.6% y/y (Trend); the annual totals up 7.7% (s.a.) and 8.1% (Trend). While still strong these rates of growth for Chinese arrivals are now the slowest in 9 years.

China continues to be the number one source country for short-term arrivals in Australia, followed closely by New Zealand, with daylight between them and the next largest source countries, the US and the UK (see chart array below).

STarrivals_plot_3

Note: I’ve produced all these charts using the Tidyverse packages in R. The development of the Tidyverse by R guru Hadley Wickham is the best thing to happen to data analysis since Microsoft Excel introduced the pivot table feature many years ago. If you want an introduction to the Tidyverse, see the excellent R for Data Science book by Wickham and Garrett Grolemund.

Posted in Tourism, Uncategorized | Tagged , , , , , , , , , , , , | Leave a comment

Fact check on PM’s comparison of GC film industry to tourism in economic contribution terms

On Monday, Prime Minister Scott Morrison made a bold claim regarding the film industry on the Gold Coast in a radio interview on Gold FM regarding the tax breaks used to lure the Godzilla vs Kong film and Disney Reef Break TV show productions to the Gold Coast (see Monsters to invade as GC lures Hollywood productions). The transcript on the PM’s website records the PM as having said:

So the film industry here on the Gold Coast is as big as the tourism industry – bigger – and so when we say we’re supporting small businesses, this is how we’re supporting small businesses.

This isn’t even close to being correct, as the economic contributions of the film industry and tourism to the Gold Coast differ by at least one order of magnitude. According to Tourism Research Australia estimates, tourism’s direct contribution to Gold Coast gross regional product (GRP) amounted to $2.6 billion or around 7.8 percent of GRP in 2016-17. While there are no comparable official figures for the Gold Coast film industry as far as I can tell, it is easy to figure out that the industry makes nowhere near the economic contribution of tourism, and most likely not even one-tenth of the economic contribution of tourism.

Consider the estimate reported in Screen Queensland’s 2016-17 Annual Review that Screen Queensland supported productions responsible for an estimated $214 million in production expenditure in Queensland in 2016-17. Given that Screen Queensland supports practically every significant film production that occurs on the Gold Coast, this suggests the Gold Coast film industry makes less than one-tenth of the economic contribution that tourism makes. The Gold Coast film industry’s economic contribution is measured in hundreds of millions of dollars, while tourism’s economic contribution is measured in billions of dollars.

Even if the film industry made a larger economic contribution, special tax breaks for the industry would still represent bad policy. It is unwise and unfair for governments to give special treatment to one industry relative to others. If one industry gets a special tax break, it means other industries (or households) need to pay higher taxes than otherwise to make up the revenue loss. It would be better for the economy overall if governments focused instead on keeping taxes on all businesses as low as possible, consistent with the need to pay for government services, of course.

For previous comments I’ve made on film industry assistance, see:

4BC Dora the Explorer interview: Do subsidies work?

Ragnarok in Brissywood

Should the Aquaman film production on the GC get a $22M tax break?

Despite the fact the vast majority of economists and state and federal Treasury officials view tax breaks for the film industry as poor policy, I expect governments will continue to offer them. Unfortunately, our politicians are attracted by the glamour of the film industry, and they greatly enjoy appearing on the red carpet with Hollywood celebrities.

Posted in Uncategorized | Tagged , , , , , , , , , , , , | Leave a comment

Daylight saving in Qld would be welcomed by hospitality sector

Tomorrow, daylight saving commences in southern states, and Queensland businesses will again experience the inconvenience of being out of sync with customers, clients, suppliers, and partners in southern states. In his latest QEAS blog post, my colleague Nick Behrens has called for a review into whether Queensland should adopt daylight saving. I agree with him, and I have previously made similar comments. For example, see my comments in this Broadsheet Brisbane article from February this year: Why Can’t We Have Daylight Saving in Brisbane, and What Are the Costs?

One potential stream of economic benefits comes from the boost daylight saving would provide to the hospitality sector. It’s obvious when you visit southern capitals how their residents are taking advantage of the extra daylight hour at the end of the day, with the sidewalk cafes and restaurants full of people.

Incidentally, Queensland’s hospitality sector could certainly do with a boost, given its recent lacklustre performance (see chart below), even though tourist numbers are up. The end of the mining investment boom a few years ago no doubt impacted the sector heavily.

plot_cafes

Of course, there is more to consider with daylight saving than the potential economic benefits. Having lived in Townsville during Queensland’s last experiment with daylight saving, in the late 1980s and early 1990s, I know that daylight saving can be difficult for many people living in the tropical north and other parts of regional Queensland. And, in many parts of regional Queensland, outdoor recreation and dining in Summer are less attractive options than they are in SEQ. The state government could consider splitting the state for the purpose of daylight saving, but that would mean regional businesses would be out of sync with SEQ businesses. We really need a comprehensive study into different models for daylight saving, and the relative costs and benefits of the different models, compared with the status quo, of course.

Daylight saving is certainly a challenging issue, but one which should definitely be reconsidered for Queensland, given the economic costs to the state that are currently being incurred and the potential benefits from greater recreational opportunities and the boost to the hospitality sector that would probably occur.

Posted in Retail trade, Tourism, Townsville | Tagged , , , , , , | 9 Comments

NSW the biggest contributor to Qld’s net interstate migration gain

Queensland has recently returned to the number one spot among states and territories in terms of net interstate migration flows, as noted in the ABS’s media release last month Queensland the most popular state for interstate movers. Queensland gained 24,000 additional people from interstate migration in the 12 months to 31 March 2018, compared with a net gain of 15,100 for Victoria, which was in number one position up until mid-2017, since when net interstate migration to Queensland has recovered strongly.

The improvement in net interstate migration to Queensland is largely due to an increase in arrivals to Queensland from NSW (see the array of charts below based on ABS estimates), which may have something to do with housing costs (until the current correction) having surged in NSW compared with Queensland, improving our relative housing affordability.

nim_plot1

While, in net terms, Queensland gained around 15,100 people from NSW in the 12 months to 31 March, we gained only around 2,100 people from Victoria, around the same amount we gained from SA, and lower than the around 2,700 we gained from WA. That said, historically, Victoria has been a major contributor of interstate migrants to Queensland. And, as the charts below suggests, net interstate migration flows to Queensland from states and territories other than NSW and Victoria are typically small.  Note that net interstate migration is the difference between interstate arrivals to Queensland and interstate departures from Queensland, which were plotted in the first array of charts above.

NIM_plot

Finally, I should note there is one state which, unlike all other states and territories, isn’t contributing people (in net terms) to Queensland: Tasmania. In the 12 months to 31 March, Queensland lost around 390 people to Tasmania, which I suspect is related to an increase in retirees moving there.

Posted in Migration, Population, Uncategorized | Tagged , , , , , , | Leave a comment

Fact check: does a majority of Qld’s population live outside the South-East?

Today’s Courier-Mail editorial Parties neglect our regions at their peril contains an interesting factoid:

…a majority of the population in this state lives outside the southeastern conurbation with a string of major provincial cities along a vast coastline…

Is this correct? No, not according to most people’s definition of South-East Queensland or the “southeastern conurbation”, which must include at least the Brisbane metropolitan region and the Gold Coast. Usually the Sunshine Coast is included, too. This is the 200 km City that Peter Spearritt first started writing about last decade.

Consider the population figures in the chart below from the 2016 Census (see this QGSO brief) which show around two-in-three Queenslanders live in SEQ. According to the Census, SEQ had 3.19 million usual residents in August 2016, while the state as a whole had 4.70 million usual residents, meaning SEQ’s share was around 68%.

regional_population_census_data

Posted in Brisbane, Gold Coast, Population, Uncategorized | Tagged , , , , , , , , | Leave a comment

Qld economy continues to under-perform

The Queensland economy continues to under-perform relative to the NSW and Victorian economies. In my post earlier this month, I noted that the Queensland economy remains lukewarm. Economic conditions are much stronger in NSW and Victoria than in Queensland, as confirmed by the job vacancies data released by the ABS last Thursday (see chart below*). Job vacancies haven’t surged in Queensland as they have in the southern states. So it’s unsurprising the unemployment rate in Queensland is 6.3% compared with 4.8% in NSW and 4.9% in Victoria. Based on the September quarter’s vacancy data, this gap will no doubt persist.

vacancies_state

Nationwide, the Administrative and Support Services industry division has experienced a huge increase in vacancies (see chart below). This industry division covers a wide range of services, including office administration, cleaning, pest control, and employment services, among others. I suspect a significant part of the growth is due to the roll out of the NDIS in the last few years.

Vacancies_industry_wrap

Queensland may be missing out on its fair share of job vacancies growth in administrative and support services (and also professional, scientific and technical services) due to our relative lack of national company headquarters.

I’d suggest the Queensland Treasury urgently investigates Queensland’s ongoing economic under-performance, delving into whether it’s due to inferior policy and regulatory settings relative to other states and territories. This could be a good job for a revived Office of Economic and Statistical Research (OESR). This arm of Treasury was doing excellent work researching the drivers of state economic growth in the late 1990s and early 2000s. But, in recent years, it has been operating under its original historical name, the Queensland Government Statistician’s Office, and it now appears to lack sufficient resources and ministerial support to undertake in-depth economic research. The state government should consider reviving OESR, with a view to better understanding Queensland’s relative economic performance.

*NB The reference day is the third Friday of the middle month in each quarter. 

Posted in Labour market, Macroeconomy, Uncategorized | Tagged , , , , , , , , , | Leave a comment

Which industries have created the most jobs in Qld over the last 10 years?

In the latest EconTalk episode, host Russ Roberts interviews the Australian robotics guru and MIT emeritus professor Rodney Brooks. After listening to the episode, I am now much less concerned about artificial intelligence and automation rendering a large fraction of the workforce redundant than I once was. I thoroughly encourage you to listen to the episode, but here’s the summary from the website:

Brooks argues that we both under-appreciate and over-appreciate the impact of innovation. He applies this insight to the current state of driverless cars and other changes people are expecting to change our daily lives in radical ways. He also suggests that the challenges of developing truly intelligent robots and technologies will take much longer than people expect, giving human beings time to adapt to the effects.

So we probably don’t need to worry just yet about those frightening predictions that up to 40 percent of current jobs could be made redundant by AI and automation. Indeed, it appears that much of the jobs growth we have seen in the last decade has been in the types of jobs it would be difficult, if not almost impossible, to replace by robots, in health, aged, disability and child care. The broad Health Care and Social Assistance industry is leading other industries in jobs growth by a long way (see chart below, based on four-quarter moving averages of the original ABS data).

Empl_growth_industry

While we don’t have a subdivision breakdown of the Health Care and Social Assistance industry division for Queensland, the Australian data can give us some insight into the nature of growth in the sector (see chart below, also based on the most recent vintage of ABS industry employment data).  Hospitals and the broader health care industry, including GPs, physios, chiropractors, and pathology labs, etc., have certainly seen strong growth over the last decade. But I was most surprised by the huge growth in Social Assistance Services. This category includes child care and non-residential aged and disability care services. subdiv_aus

Child care employment has surged, in part, due to the adoption earlier this decade of the National Quality Framework which imposed minimum staff-to-child ratios, depending on the ages of the children at child care centres (see p. 6 of the excellent report Why Childcare is not Affordable by the CIS’s Eugenie Joseph).

In case you’re interested in the relative sizes of the different industry sectors in Queensland, here’s another facet wrap I’ve produced in the R package gglot2 (N.B. I’ve left out the three smallest industry sectors).

empl_ind_qld

Posted in Labour market, Uncategorized | Tagged , , , , , , , | 2 Comments