
Higher unemployment among young Queenslanders than their peers in southern states, as well as a higher proportion of 15-19 year olds in the labour force, account for a large part of the difference between Queensland’s unemployment rate, stuck at just over 6%, and the rate in the rest of Australia, which is approaching 5%.
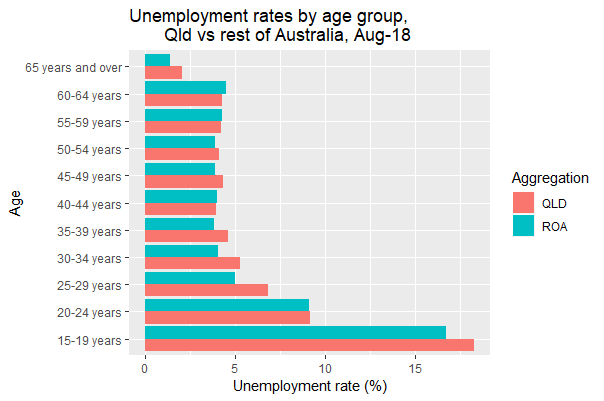
First, consider the significantly higher unemployment rates for younger age groups in Queensland than in the rest of Australia, except for the 20-24 year old age group (see chart below, based on 12-month moving averages of ABS original data). The transition from education to work appears equally difficult for 20-24 year olds across Australia, but, for people aged 25 to 39, unemployment rates are significantly higher in Queensland. This could reflect a relatively weaker professional jobs market in Queensland than in other states in recent years.
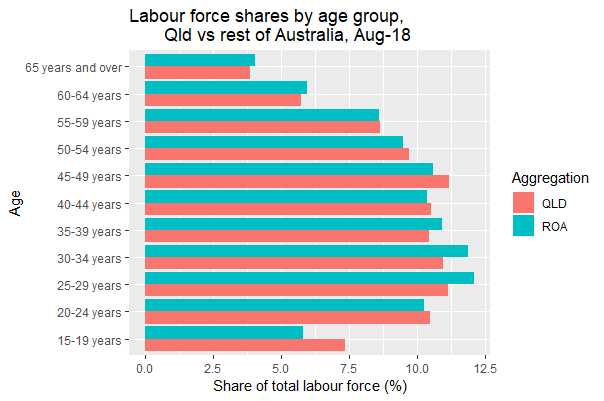
Second, consider that Queensland has a larger share of its labour force (i.e. employed and unemployed persons) coming from the 15-19 year age group than does the rest of Australia (see chart below). To an extent, this is related to Queensland not having had a compulsory prep year until very recently, and therefore having a higher proportion of the 15-19 year old cohort looking for work than the rest of Australia. Having a larger share of its labour force in the 15-19 year age group partly explains Queensland having a higher unemployment rate than the rest of Australia, because the 15-19 year old age group typically has a high unemployment rate, well above the average of other age groups.
But how much of Queensland’s higher unemployment rate is due to having more 15-19 year olds in the labour force, and how much is due to different age groups having higher unemployment rates than their peers in other states? This is relatively straightforward to estimate, given the overall unemployment rate can be expressed as a weighted average of age-specific unemployment rates (i.e. the data in the first chart), where the weights applied are the age-specific shares of the total labour force (i.e. the data in the second chart).
The 0.8 percentage point difference between Queensland’s unemployment rate (at 6.1% in August) and that of the rest of Australia (5.3% in August) can be decomposed into what I’ll call a rate effect and a share effect.* The rate effect measures the impact of Queensland having different age-specific unemployment rates than in other states, while the share effect measures the impact of the different age composition of Queensland’s labour force on the unemployment rate. These effects can be calculated for all the different age groups (see chart below), and then aggregated to determine the overall impacts.
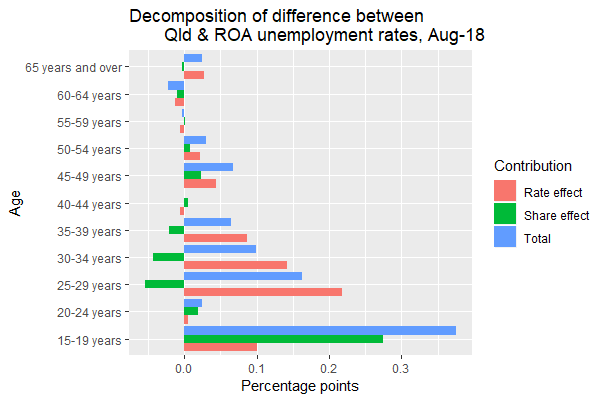
Overall, aggregating across the age groups, Queensland’s 0.8 percentage point higher unemployment rate can be approximately decomposed into:
- 0.6 percentage points related to higher age-specific unemployment rates (the rate effect), largely associated with age groups under 40; and
- 0.2 percentage points related to Queensland’s labour force having a different age composition, with proportionately more 15-19 year olds, an age group which typically has a high unemployment rate.
So Queensland’s higher unemployment rate is only partly explained by the state having a different age composition of its labour force, and I expect this age composition impact will decline in future years as a result of the prep year introduced in 2007 and made compulsory in 2017. Queensland’s higher-than-national-average unemployment rate is mostly related to our relative economic under-performance in recent years.
*Technical note: economists generally label the technique I’m using as shift-share analysis. The estimates in this post are based on ABS labour force data up to August. As noted above, the original (i.e. not seasonally adjusted nor trended) data published by the ABS were smoothed using a 12-month moving average. The September data will be published by the ABS on Thursday, but I don’t expect the story to change significantly.

Gene, thanks for this insightful analysis.
Am I correct in guessing that the relative deficit of 25-40 yo workers (the negative green “share effects” in these ages in your third graph) is related to the “brain drain” effect? IE: that tertiary qualified workers have to move interstate to find attractive work that suits their qualifications?
If my guess is correct, then that is the scariest observation in your data! The Queensland economy needs to find attractive value-adding enterprises to attract and retain that bright generation.
Thanks Mike. Great question and comment. Yes I think there is a brain drain effect at work too. I’ll have to cover this issue in a future post.