
Regarding my previous post noting SEQ’s dominance in population terms, regular QEW reader Mike Willis commented perceptively:
Gene, it seems the concentration will be reinforced, if the most recent Qld government statistician’s report is any guide. State population growth is expected to be 2.3m from 2016 to 2041, of which 1.3m is in the greater Brisbane region alone (defined as Brisbane, Ipswich, Logan, Beaudesert and Moreton Bay)… http://www.qgso.qld.gov.au/products/reports/qld-govt-pop-proj/index.php
If you add in the Gold & Sunshine Coasts, your Pareto principle looks like it will be even more concentrated, with the South East corner taking well over 80% of the state’s growth.
This presents some challenges for future governments in terms of infrastructure, with transport and health services (in particular) already pressured by the current growth. The state debt level will compound this challenge.
Of course, there are opportunities for decentralisation of government services and hubs into regional and near-coastal cities, many of which offer great lifestyles.
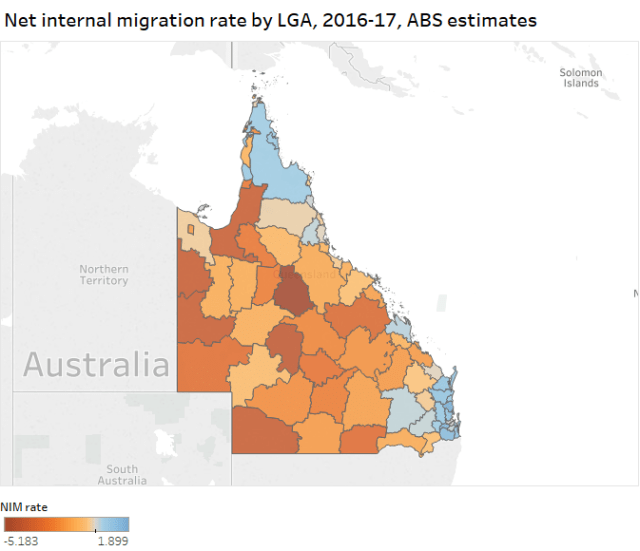
This increasing concentration of people in SEQ is due in large part to net internal (i.e. within Australia) and overseas migration, as both fellow Australians and immigrants are attracted to SEQ’s employment, business and lifestyle opportunities relative to many other parts of the state. Typically, rates of net internal migration and net overseas migration are much higher in SEQ local government areas (LGAs) than in other regions of the state. For instance, check out the thematic map below of the net internal migration rate for Queensland’s LGAs in 2016-17, the latest available data published by the ABS. The net internal migration (NIM) rate is net internal migration (arrivals minus departures) in 2016-17 expressed as a percentage of the population in 2015-16. Note that in 2016-17 the NIM rate was negative in many parts of regional Queensland, which in part would be attributable to the end of the mining investment boom and also drought.
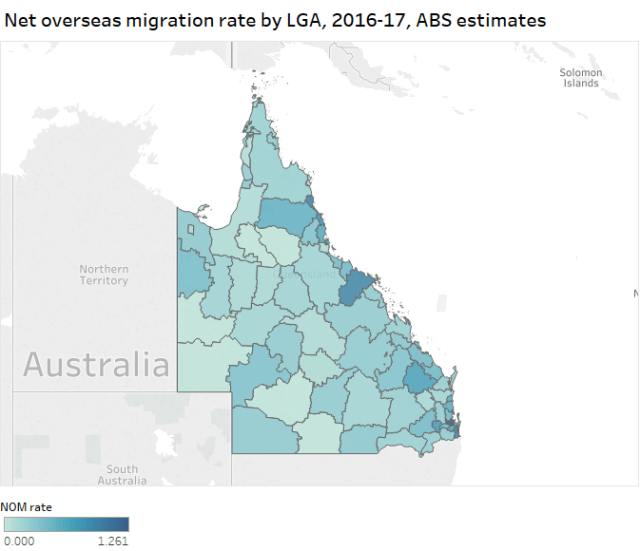
And here’s a map showing rates of net overseas migration, which are also typically higher in SEQ, although well-positioned coastal LGAs such as Cairns, Douglas, Cassowary Coast and Whitsunday also do well:
For greater clarity here’s a closer view of southern Queensland:
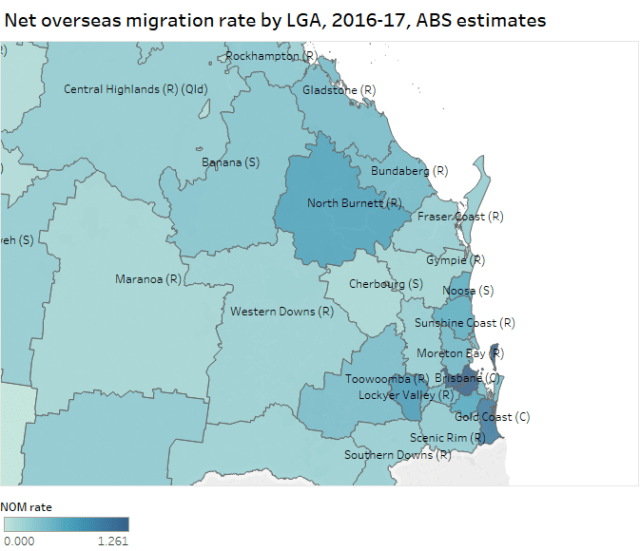
Unsurprisingly, especially given the huge growth in international education in recent years, Brisbane has the highest rate of net overseas migration in the state (and also rather obviously, as it’s the largest LGA, the highest population gain due to net overseas migration).
I acknowledge the data I’ve presented in this post are only for a single year; I could quickly generate these maps as I’d used the data set in my previous post. In a future post, I intend to discuss longer-term trends based on the Census data. But I expect the story will be the same. For instance, see this article on the ABS website by UQ researchers, which shows SEQ regions the Gold Coast, Sunshine Coast, Ipswich and Moreton Bay as having the highest net internal migration rates in the five years to the 2016 Census night:
Understanding internal migration in Australia
Finally, on the increasing predominance of SEQ, also consider the projections in Jobs Queensland’s Anticipating Future Skills report (discussed on p. 15):
Around 75 per cent of growth in employment is projected to occur in the major population centres of South East Queensland. Brisbane and Ipswich are forecast to account for employment growth of 75,000, with a further 34,000 on the Gold Coast, 21,000 in Moreton Bay – North and – South (combined) and almost 14,000 on the Sunshine Coast. Employment in Queensland – Outback is projected to decline under the baseline scenario…
Councils outside SEQ will need to think even harder about how to improve the relative attractiveness of their regions to potential residents and investors with a view to counteracting the strong pull of SEQ.

Great article Gene.
I’ll never forget talking with an American at last years ANZRSAI confernce in Toowomba.
She asked why Australians were so focused on population growth and why we thought population growth was good per se.
It did get me thinking.
There seems to be an assumption many Australians have that population growth – or at least inward migration – is a good thing for the economy, or a sign the economy is performing well.
Is seems obvious … But there are costs of population growth. Some are well known if you look at high population growth areas. And people do move for non-economic reasons.
Is it always the best outcome for areas to have population growth? Will more people always improve an areas economy?
Thanks Alistair. Excellent points. Yes, we should have and indeed nationally we are having a debate about the pros and cons of the current rate of immigration.
Great article Gene, I am still amazed that in the face of what is the inevitable declines in the regions outside the south east, particularly Nth Qld, that the population in these areas are still unable to represent themselves better for a different outcome. I am still surprised that Nth Qld has still not managed to ditch the two Brisbane based parties in favour of a dedicated Nth Qld party, which could in turn hold the balance of power at each and every election and effectively hold the state to ransom, in the same way senators from Tasmania and South Australia have done over the years in the federal parliament. I guess it proves the sheep mentality still exists even when being lead to the meatworks.
Yes I think it does. Katter has tried to position himself as the force from the north but he obviously doesn’t appeal to a broad enough segment of the population. And Palmer isn’t too popular in NQ after Yabulu is he?