Comments on BrewDog being lured to Brisbane in the Broadsheet

I was interviewed by Matt Kirkegaard, beer educator and commentator, for his latest article in the Broadsheet:

Is Scottish Superstar BrewDog’s Arrival Good for Brisbane’s Brewing Scene?

The debate over whether the Queensland Government should have offered financial incentives to lure the Scottish craft beer company to Brisbane was started by my colleague Nick Behrens, Director of QEAS:

Why the State Government is ‘NUTS’ to offer Scottish beer giant BrewDog industry assistance

Both Nick and Matt were interviewed by 612 ABC Brisbane’s drive time presenter Steve Austin on the issue last week:

The Beer Economy: Is BrewDog a good investment for Queensland?

Finally, if you’re interested in beer, check out Matt’s website:

https://www.brewsnews.com.au/

Newstead Brewery

I was lucky enough to go on a tour of the Newstead Brewing Co. at Milton last year

Posted in Industry policy, Uncategorized | Tagged , , , , | 2 Comments

Disproportionate numbers of Newstart/Youth Allowance recipients in Far North Qld, Wide Bay-Burnett & Logan

Pete Faulkner’s post Job Seeker data shows little change for Cairns alerted me to the latest data on recipients of Newstart and Youth Allowance (for young job seekers) from the Commonwealth Department of Social Services. These data highlight the ongoing lack of economic opportunity in Far North Queensland (outside of Cairns and surrounding regions) and North West Queensland, which are home to many remote Indigenous communities (see map below). In the Far North ABS SA3 region, job seekers receiving Newstart or Youth Allowance account for over 12% of the working age population. The Wide Bay-Burnett region also has a relatively high incidence of Newstart and Youth Allowance recipients (at 6-7% of the working age population).

Newstart_Qld

Stark differences in the numbers of Newstart and Youth Allowance recipients exist across Brisbane metro regions. The leafy western suburbs have a very low incidence (at 1-1.5% of the working age population) while the Springwood-Kingston area has around four times the incidence of Newstart and Youth Allowance recipients (over 6%).

Newstart_Brisbane

The high concentration of disadvantage in particular regions and suburbs should be of serious concern to policy makers. It should prompt them to encourage job creation through lower taxes, better regulation, and a more supportive attitude to economic development. Policy makers also need to ensure Australia does not have a tax-welfare system that discourages employment via high effective marginal tax rates for welfare recipients.

Posted in Labour market, Uncategorized | Tagged , , , , , , , , , , | 5 Comments

Value Capture: Making Sense of Policy Options – guest post by Brad Rogers

value_capture_conference

I am delighted to publish this guest post from Brad Rogers, Director of DeltaPearl Partners, on value capture, the topic of a conference his firm will run in Canberra in July. Views expressed are Brad’s and should not necessarily be attributed to me. GT

Value Capture: Making Sense of Policy Options

by Brad Rogers

Many state governments in Australia are turning to ‘innovative’ ways to fund new city infrastructure to meet rising demand. Value capture is being widely but loosely discussed in relation to government funding solutions.

Different variations of value capture methodologies have been used by various governments and organisations over time. However, more recently in Australia, governments are seeking new ways which are politically tenable and economically feasible to use value capture mechanisms to fund new large infrastructure projects.

Value capture

The basic value capture approach being considered in Australia is that a government builds an infrastructure item, typically public transport, and then seeks to recover some or all of the capital and running cost of the infrastructure via a charge to those assessed as being beneficiaries of the new infrastructure. The charge is assumed to capture only part of the total benefit accruing to each beneficiary, thus leaving those people with a net benefit from the investment.

However, as with most things in economics and policy, the story is not that simple. Necessarily, economists and policy makers make large simplifying assumptions about many things in their assessment of the benefits, including the size of an individual benefit, responsiveness of demand to price changes, and the attribution of cause and effect.

Other funding methods

Economic efficiency arguments suggest that user pays systems are the most efficient in targeting the value capture of benefits; that is, the users who value the benefits the highest would be willing to pay for the use of the new infrastructure. However, the user pays system (compared with funding by general taxation) can be politically difficult because it can be described by opponents as a tax.

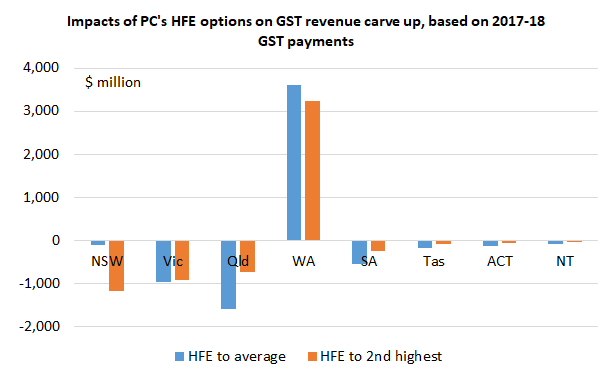
On the other hand, general tax revenue constraints could force state governments to implement value capture mechanisms. The current system of taxation has constrained the ability of state governments to implement taxes and depends heavily on the GST distribution system from the Federal Government. Could amendments to the current general tax system, including the GST distribution, provide state governments with the funding required to underpin good infrastructure and remove the need for value capture taxes by the state? Would these broad-based taxes be a more efficient and effective way of taxing the population for the infrastructure required?

Tax makes up approximately 36 per cent to 44 per cent of the cost of housing in Australia. On top of this, people living in these houses are likely to also be paying income tax (including capital gains tax), GST, company taxes (directly or indirectly in shares), Medicare levy, and any number of other taxes. Thus, the question remains whether adding a value capture charge is only going to add to this burden, and how the cost of value capture options might drive net economic benefits

Funding and finance

There are many questions still remaining about the actual cost to the economy of the value capture funding method as opposed to the traditional government borrowing to fund projects. In the traditional model of infrastructure funding in Australia, the government will borrow at the low government bond rate to build infrastructure. The theory goes that this increases economic activity, which then results in greater tax receipts which it can then use to pay back the borrowed funds over long periods of time.

Depending on how you want to break it down, there are approximately eight stages to developing a government infrastructure project, including strategic plan, project selection, contract development, borrow money, design, build, own, operate, and capture value. Each stage of this project development process could be completed by the government or by private contractors.

Value capture mechanisms are being tied to Public Private Partnerships (PPPs) and other related project financing arrangements – for example, the Hong Kong Mass Transit Railway (MTR)[1]. The MTR value capture example is often used as the model for Australian governments, where the Hong Kong Government decided on the strategic plan and project selection; then Hong Kong’s Mass Transit Railway Corporation’s (MTRC) purchased the right for a period of 50 years to develop property above railway stations and depots, as well as on land adjacent to the railway. The “land premium” paid to the government did not consider the value creation from the transport project (the ‘before rail’ land premium). The MTRC sold the development rights to private developers with profit share arrangements for the life of the contract; therefore, capturing the post-development value created.

Another option for value capture funding includes user pays, which has the benefit of providing a feedback between demand and price. That is, if you take a train or bus you get the benefit and therefore you should pay the full cost recovery fare; rather than the current heavily subsidised fare.

Road costs could be recovered via a road toll. Congestion charging, and road tolls, in place of simple car registration costs are one of the biggest policy ideas that governments face. The cost of congestion on the economy is getting larger by the day and the cost to build our way out of the problem would be far too expensive due to the inevitable induced demand. When a road becomes congested on a regular basis the cost to the individual for using the road is mostly the time spent waiting in traffic, as there is no toll to pay for each use.

If a government spends money to widen the road to allow more traffic to flow it will lower the cost to individuals due to reduced time lost, therefore, more people will use that road. That is, the government supplying more road space encourages or induces more people to drive on that road (demand) until it is again congested. This cycle continues until there is no room to expand and a more expensive option is required like a tunnel. However, if people face the cost of decisions they make it would encourage the community to make better decisions that would lead to a more efficient and productive economy.

Of course, politically a toll on roads would be very difficult to implement as people can see the cost of a toll as they pay it, but the large tax increases are hidden, distant, and assumed to be paid by someone else. However, a user pays system that includes road tolls would put pressure on the entire community to make better decisions about the locations of businesses and housing. Over the long-run the community would restructure itself to a more efficient town planning and transport system.

Attribution of Benefits

Economists have developed some level of measurement to attribute value creation to particular actions of government at a broad community wide level of detail; for example, increase in consumer surplus (through travel time savings), productivity gains, agglomeration benefits, reduced congestion and lower greenhouse gas emissions. However, as with many things, it works from the helicopter view but may not actually play out on the ground.

A key method of estimating the value created is by measuring the value uplift of property in the geographic area in question using hedonic pricing studies; that is, how much did the property values increase around the new infrastructure when it was built[2]. However, we are not able to separate all the thousands of things that happen in a community that affect property prices in a way to be able to attribute a specified value to one action for the hundreds of households.

There is some leading thought leadership taking place.  My recent work with Arcadis, the world’s largest engineering consulting firm, has introduced me to their proprietary MODex3 model. Arcadis has experience from around the world in the development of transport hubs and its methodology for maximising value creation, and it has used this experience to develop MODex3 to estimate the value of transport hubs and to assist in value capture modelling. The model depends on a data base of information collected from projects around the world. The data was calibrated to be able to compare projects. The output of the model is 10 indicators that are derived from 70 variables.

In reality, when the government comes calling on your home to ask you to pay a value capture tax their understanding of your individual willingness and capacity to pay is very limited. However, every household will have a different perception of value, capacity, and willingness to pay. Governments making a sweeping assumption about an entire community are going to make errors that impact on some sections of the community much more than others.

Conference

DeltaPearl Partners’ conference Value Capture: Making Sense of Policy Options 9 July 2018 in Canberra will seek to explore these and other related issues with the support of government, institutional, industry and academic speakers from around the world. Please see more information about the conference at this website:

The Value Capture conference is aimed at exploring the key issues related to value capture in Australia by hearing from experts from Australia and around the world who have experience in the application of value capture and academics with current analysis of the issues. Also, note all Economic Society of Australia members are eligible for a 10 percent discount to attend the value capture conference. For registration to the Value Capture conference please follow this link: https://consec.eventsair.com/value-capture-conference/delegate-registration/Site/Register

End notes

[1] Mathieu Verougstraete and Han Zeng, July 2014, United Nations Economic and Social Commission for Asia and the Pacific, Land Value Capture Mechanism: The Case of the Hong Kong Mass Transit Railway, Viewed 29 January 2018, http://www.unescap.org/sites/default/files/Case%204-%20Land%20Value%20-%20Hong-Kong%20MTR.pdf

[2] Jonathon Clark-Jones, Nicholas Harvey, Filip Milosavljevic & Preeti Singh, Under Guidance of Flavio Menezes, November 2016, Implementing Value Capture for Transport Infrastructure Applicability for South-East Queensland, Viewed 5 February 2018, http://uq.edu.au/economics/documents/Implementing%20Value%20Capture%20for%20Transport%20Infrastructure.pdf

Brad Rogers is Director of DeltaPearl Partners and President of the ACT Branch of the Economic Society of Australia.

Posted in Infrastructure, Uncategorized | Tagged , , , , , , , , , , , , | 3 Comments

Grant Thornton argues Qld’s gold royalty rate is uncompetitive

Yesterday, at the Resources Discussion Lunch held at the Catchment Brewing Co., West End, attendees reflected on the large financial markets correction that had just occurred, but remained optimistic about the global economy. Resources sector veteran Rob Murdoch was an excellent MC who facilitated a highly enlightening and entertaining discussion of critical trends and issues affecting the sector. As you would expect at such a gathering, the issue of royalty rates was raised, and AMEC CEO Warren Pearce presented on a new Queensland Gold Royalty Rates Discussion Paper from Grant Thornton which argues:

…the current royalty rates payable by gold producers in Queensland are harming the competitiveness and future growth prospects of the local gold sector.

The report compares Queensland’s gold royalty rate, at current gold prices, of 5% with rates in NSW, SA and WA in the 2-3.5% range, and argues Queensland’s higher rate makes it less likely Queensland would see exploration for gold than other states.

The discussion paper is very interesting and should encourage further investigation, particularly by the Queensland Treasury. Alas, the discussion paper does not present any economic modelling of the impacts of changes in the gold royalty rate on Queensland Government revenue (possibly an impact of up to $20 million p.a.) or on resources sector investment and jobs. While it’s very unlikely we’d see a gold mining boom similar to the 19th century boom again in Queensland, a more competitive royalty regime may encourage some additional economic activity and jobs that would be welcome in regional Queensland.

gold

Posted in Mining, Uncategorized | Tagged , , , , | 4 Comments

ABC radio interview on PC inquiry into GST revenue redistribution

I had an enjoyable chat with Steve Austin on his ABC Brisbane radio Drive program this afternoon regarding the Productivity Commission’s Brisbane hearing for its inquiry into Horizontal Fiscal Equalisation (HFE), the methodology which is used to distribute the GST revenue pool across states and territories. You can hear my reflections on today’s hearing from around 1:42:40:

Steve Austin’s 612 ABC Brisbane Drive program, 5 February 2017

You may recall from Nick Behrens’ previous PC inquiry post that the two main options for HFE reform proposed by the Commission would imply a reduction of revenue for Queensland of at least $700 million and up to $1.6 billion p.a. based on current economic parameters (see chart below which I’ve reproduced from the post), so it is an important and topical issue.

I attended the inquiry earlier in the day, and heard presentations from Griffith University, CCIQ, QCU, QTU, QCOSS, Townsville City Council, LGAQ, and finally from the Queensland Government, which was ably represented by our Deputy Premier-Treasurer Jackie Trad and my old Commonwealth Treasury colleague Jim Murphy, now Queensland Under Treasurer. The Under Treasurer made a strong case for why the HFE system has mostly worked well, and argued the system shouldn’t be changed radically just because WA is now complaining. Indeed, as Mr Murphy seemed to be hinting, WA’s current fiscal mess is partly of its own making. As I discussed with Steve, WA spent too much of the surge in revenue it received during the mining boom, while it should have been saving for a rainy day. I should note Deputy Premier Trad had previously made one of the points which Mr Murphy expanded on in his remarks, when, as reported by the Brisbane Times, she noted:

While we believe the current system can be improved, we believe introducing a fundamental change to combat a potentially temporary situation faced by one state is not prudent.

Overall Trad and Murphy made a very effective team in arguing for the state’s interests, and I regret I didn’t give Trad more credit in my interview with Steve. However, the Queensland Government does deserve one black mark against it, for an hysterical media release earlier today which, among other egregious claims, stated the Productivity Commission “doesn’t understand Queensland.” This must have come as a surprise to Productivity Commission Deputy Chair Karen Chester, who attended today’s hearing. The Deputy Chair is a former Queenslander and was a UQ economics first class honours graduate in the mid-1980s, before going on to become one of the youngest ever Commonwealth Treasury SES officers. Let’s hope the government’s media releases improve markedly, because today’s effort was lamentable.

hfe_chart

Posted in Budget, Queensland Government, Uncategorized | Tagged , , , , , , , | 2 Comments

Bold BDO’s vision: half of mining jobs automated by 2020

BDO has published an extraordinary report presenting its vision of a massive uptake of robotics in the mining sector in the next few years. In its Near Future of Mining Report BDO speculates:

By 2020, robots will replace more than 50 percent of miners, and mining accidents will be cut by 75 percent. Half of the miners will themselves be retrained to run the technology controlling the robots.

This seems too soon, just two years away, for such an extraordinary transformation of the sector, but, as BDO explains, it is simply a continuation of the existing trend toward automation that has already seen the adoption of driver less trucks and drones (e.g. see How drones are changing mining).

The increasing automation of the sector means we may not see a strong pick up in employment in the sector as the sector’s resurgence continues, although clearly there will be local jobs programming and maintaining robots, driver less vehicles and drones. It also means indirect economic impacts (i.e. multiplier or flow-on impacts) in the Queensland economy would likely be lower in the future, particularly given much of the robotics to be used in mining applications would be imported. Nonetheless, the resources sector will continue to be important to the Queensland economy, and to the Queensland Treasury through the $3-4 billion in royalty revenue each year, but we may not see it employ as many people as it did at the peak of the last boom again (see chart below).

mining_Nov17

On balance, the boost in productivity through robotics would be a positive development, and it would mean that freed up labour can be used elsewhere in the economy (so long as we have a flexible economy without excessive labour and product market regulations and we have an efficient and effective education and training system). Our current policy settings will be subject to a huge test over the next few decades as robotics and artificial intelligence continue to transform our economy.

Posted in Mining, Uncategorized | Tagged , , , , , , | 1 Comment

Why is it so? Regional Qld airfares 2-3 times higher than in the city – guest post by Craig Wilson

I am delighted to publish this guest post from my former colleague Craig Wilson, who is now Managing Director of DeltaPearl Partners. Craig will be well known to many readers as a result of his former senior executive position in the Queensland Department of Premier and Cabinet. His guest post is based on recent work he has undertaken for Mount Isa City Council. The post contains Craig’s views, and they should not necessarily be attributed to me. I am sure Craig would very much welcome comments on this guest post. GT

Why is it so?  Regional Queensland airfares 2-3 times higher than in the city

by Craig Wilson

Toward the end of 2017 the Australian Senate announced an inquiry into the operation, regulation and funding of air services into rural, regional and remote in Australia. Among other things the inquiry will consider air fare pricing, competition, regulation and service quality as well as the socio-economic impacts of these things on communities and the economy. The announcement of such an inquiry is not surprising – the issue of high air fares and poor service quality on flights in and out of regional centres has been a hot button issue for communities across the country for some time.

Let’s take Mount Isa, for example, whose City Council has prepared a detailed submission to the Senate inquiry investigating regional air services.

Mount Isa is a significant regional centre in northern Australia and lies at the heart of the North-West Minerals Province, the largest zone of mineralisation of its kind in the world. The Mount Isa economy generates around $2.4 billion annually in value-added output and $1 billion annually in tax revenues for the state and federal treasuries.

Despite this significant economic contribution, regional centres such as Mount Isa feel second class because of the price and quality of air services they receive and, as a consequence, communities and local governments are becoming increasingly vocal in their demands for a better deal. At a headline level, the analysis in the Mount Isa submission has found that, on a per kilometre basis, Mount Isa travellers are paying two to three times more in air fares than passengers flying out of Australia’s major metropolitan centres on comparable journeys (Table 1).

cw_table1.png

Mount Isa residents state that it is often cheaper to fly overseas than to fly to Brisbane. To compound the disparity, service standards are typically lower with older aircraft and fewer onboard services such as food and entertainment.

Excessively high air fare prices impede the growth of business, especially small business, and isolates residents and lessens their quality of life. Local residents argue that this is a bitter pill to swallow when they see high subsidies for public transport in south-east Queensland, and high subsidies going to under-utilised passenger rail services in regional Queensland. They do not understand why they are exposed to the high price of market failure and/or monopoly pricing, and they believe the second-round economic effects of this policy failure are adverse.

It is also difficult for young families to move to, and remain in, Mount Isa as it is so expensive to fly and to keep in contact with family and friends outside Mount Isa. For example, a family of four thinking about flying to Brisbane will save over $2,000 by driving 900 km to Townsville to catch a flight. In cases of unplanned travel such as a medical emergency, residents can expect to be hit with one-way fares of more than $1,000.

Since the aviation reforms of the 1990s, passenger numbers on most major Australian aviation routes have boomed off the back of lower airfares and greater choice of carriers (Figure 1).

Figure 1: Index of real airfares, 1992 to 2017

CW_Figure1

Source: BITRE, 2017, Domestic air fares indexes.

However, in preparing its submission, the Mount Isa City Council found that the benefits of these reforms have largely by-passed Mount Isa and other similar centres. The submission concludes that discounted air fares are rare and passenger numbers through the local airport have barely changed in 30 years (Figure 2).

Figure 2: Index of domestic passengers, 1985-86 to 2016-17

CW_Figure2

Source:  BITRE 2017, Airport Traffic Data.

A range of factors contrive to generate these untenable high cost and low-quality air services in regional centres. These factors include lack of competition, exposure to monopoly-owned asset operations (i.e. regional airports), government policy restrictions, high taxes and charges, and lack of transparency on costs.

Analysis has shown that Queensland Government transport subsidies in south-east Queensland are not replicated for transport services for communities in regional Queensland. An examination of Queensland Government expenditure on public transport shows that it is concentrated in south-east Queensland, especially on the city rail network. The result is that the state government supports public transport to the extent of $568 per person per annum in the south east. This is almost two times (85%) more than the $308 per person the Queensland Government spends on public transport in the remainder of Queensland.

Meanwhile, federal government support is limited to modest subsidies for tiny rural airports servicing communities of less than 200 people. Known as the Remote Airstrip Upgrade Program, this subsidy provides funds to improve runway surfaces, storm water drainage and navigational aids. For example, in 2015 $11.8 million was provided for upgrades at 52 aerodromes and a further $11.6 million was committed for 2017.

It is defensible to say that the Mount Isa City Council submission reflects a commonality of issues facing other comparable regional centres. The Mount Isa City Council has, consequently, developed a set of hard-hitting recommendations, arguing that a half-hearted response won’t suffice.

Continue reading

Posted in Mining, Transport, Uncategorized | Tagged , , , | 9 Comments

ABC Brisbane radio interview on CommSec & Deloitte economic reports

I had an enjoyable chat yesterday afternoon with Steve Austin on the 612 ABC Brisbane Drive program regarding the latest CommSec and Deloitte economic reports which had generated political debate during the day. While state Treasurer Jackie Trad highlighted that Deloitte was forecasting Queensland would lead the nation in economic growth, the Opposition was critical of Queensland’s sixth place in CommSec’s State of the States ranking. Steve asked me about the respective merits of both reports, and you can hear what I had to say at this link at around 2:02:30:

Steve Austin’s Drive program, Monday 29 January 2018

In the interview, I expanded on the comments I made regarding the reliability of economic forecasting in my post from yesterday:

Comments on Deloitte’s latest economic outlook for Qld

I also criticised the CommSec State of the States Report. To illustrate the point I made to Steve about the problem with the CommSec methodology, which ranks states according to how their current indicators deviate from decade averages, see the chart below of one of the indicators used: construction work done. In Queensland, in September quarter last year construction work done was nearly 18% below the average of the ten years to that quarter. This was unsurprising given the huge and unprecedented construction boom associated with the construction of the LNG plants at Curtis Island, and also because of the large amount of construction activity associated with state government responses to the water crisis and natural disasters, among other things. Queensland really shouldn’t be penalised for now falling below the decade average in a comparison across states, as occurs in the CommSec State of the States report.

Commsec_methodology_construction

Also see my previous comments on the State of the States Report from CommSec:

CommSec State of States report misleading on population growth

CommSec’s State of the States misleading on Qld’s economic performance

Ask a silly question, get a silly answer

Posted in Macroeconomy, Uncategorized | Tagged , , , , , , , | Leave a comment

Comments on Deloitte’s latest economic outlook for Qld

The latest economic reports from Deloitte and CommSec are out and, no doubt to the disappointment of their respective media officers, are both covered in the same Courier-Mail report this morning by John McCarthy:

QUEENSLAND appears to be stuck near the bottom rung of the economic performance of states, but reports released at the weekend claim the “storm clouds continue to clear’’ for the Sunshine State.

A Deloitte Access Economics report said Queensland had returned to its status as a preferred destination for Australians on the move.

I agree the “storm clouds continue to clear”, as I have been noting on this blog for over a year now, including in my recent posts Qld’s economic outlook for 2018 and Surge in Qld youth employment over 2017. And Deloitte is correct that Queensland has returned to the lead over other states and territories in net interstate migration, but the lead over second-placed Victoria is very small, only around 240 people in 2016-17 (see chart below). Furthermore, net interstate migration remains well below historical highs.

Interstate_migration_Qld_leading

Apparently, Deloitte is forecasting Queensland economic growth of 3.5% p.a. and higher for the next four years, which is significantly higher than Queensland Treasury’s forecasts of 2.75% in 2017-18 and 3% in 2018-19. Of course, the reliability of precise forecasts several years out is very low. So it is courageous for Treasurer Trad to predict Queensland will lead the other states in economic growth “in each of the next four years”, as reported by the Courier-Mail.

Consider that, in December 2015, Deloitte was forecasting Queensland economic growth in 2016-17 of around 3.75%, with Queensland expected to grow faster than all the other states and territories except for WA and NT (see p. 6 of Deloitte’s Business Outlook from December 2015). But, according to the ABS State Accounts, Queensland ended up with the third lowest rate of economic growth in 2016-17 (1.8%) and WA ended up contracting 2.7%! For 2015-16, Deloitte forecast that Queensland would have the highest economic growth rate in Australia, but we ended up in only fourth place. Alas, economies are inherently difficult to forecast and, in my view, the utility of forecasts beyond the next six to twelve months is extremely low.

Posted in Macroeconomy, Uncategorized | Tagged , , , , , , | 2 Comments

Has Qld dropped the ball on the GST Carve-Up Review? Guest post from Nick Behrens

I am delighted to publish this guest post from my colleague Nick Behrens from QEAS on the GST redistribution inquiry currently being undertaken by the Productivity Commission. Views expressed are Nick’s, and are not necessarily shared by me. That said, I find it regrettable the PC’s draft inquiry report advances options that forgive WA for its poor public financial management during the term of the Barnett Government, to the detriment of all other states and territories. Queensland certainly needs to exert influence on the PC inquiry before it finalises its report later this year, as Nick argues below. GT

Has Queensland dropped the ball on the GST Carve-Up Review?

by Nick Behrens, Director, QEAS 

Many readers will no doubt be aware that the Productivity Commission is currently undertaking an inquiry into Australia’s system of horizontal fiscal equalisation (HFE), which underpins the distribution of GST revenue, and has been an issue of hot contention among States and Territories for decades. The Inquiry is considering the influence the current system of HFE has on productivity, efficiency and economic growth and whether there may be preferable alternatives.

I have previously asked is this Inquiry a threat or an opportunity for Queensland given that in 2017-18 as a State we will receive close to $15 billion in GST or 24 per cent of all money available despite having only 20 per cent of Australia’s population.  My view is it is undoubtedly a threat.

The proposal with the most profound implications for Queensland is that HFE should no longer aim to raise the fiscal capacity of each state to same as the highest state (currently WA), but instead to the average or to the second highest State (currently NSW). If actioned, Queensland will continue to be a net beneficiary of GST distribution. However, the extent of our benefit would be reduced by $729 million each year if HFE is to the second highest state or by $1.6 billion if it is to the average. These numbers would change from year-to-year, as the extent of HFE in Queensland’s favour varies from year-to-year, and has at times resulted in a re-distribution away from Queensland (when we were penalised for high royalty revenue). However Queensland has generally been a beneficiary of HFE, and the PC’s proposals are expected to be adverse for the State over the long-term.

My fear is that Queensland is being outgunned in the war among States in advancing their interests. It appears we may be more reliant on political rhetoric to progress our case as opposed to the substance of good representation underpinned and advanced through evidence and statistical research. While there are some very good and well reasoned arguments advanced in the Queensland Government’s submissions, I think we can do considerably better. Our arguments are articulated in theory and words and lack research and statistics to underpin them, which is surprising given the high calibre of Queensland Treasury individuals.

Page count is a crude metric by anyone’s measure, but a quick analysis of submissions to the process by each State Government reveals Queensland has the lowest page count among all the State submissions.

State Government Submission Page Counts

Initial Submission Post Draft Report Submission Total
NSW 64 44 108
VIC 26 30 56
QLD 16 14 30
WA 122 47 & 15 184
SA 26 19 45
TAS 50 42 92
ACT 92 78 170
NT 44 32 76

Those States that are cross-subsidising the most (like Western Australia) spent the most amount of effort arguing for how the current system is eroding their capacity to deliver services. Oppositely, those States and Territories that receive the highest level of equalisation like Northern Territory and Tasmania also spent significant effort in putting their submissions together.

In its follow-up 14 page submission to the inquiry, Queensland has diligently highlighted the impact that changes would have on the capacity to provide services. At the same time Queensland highlighted that, in its view, the case for change due to erosion of national productivity and growth had not been made by the other States.  Queensland Treasury states:

“Queensland continues to remain unaware of any evidence that this is a factor for governments in the setting of expenditure and revenue policies.

Where potential HFE impacts are considered in the policy decision making process, they are at best fourth or fifth order considerations. This means that many of the incentives or disincentives that are identified in the literature, and mentioned above, exist in theory but not to any material degree in practice.

Additionally, as Queensland set out in its initial submission, the most immediate benefit brought about by the current system of HFE is arguably in the services it allows States to provide. Any change proposed to HFE on the grounds that it will reduce disincentives to pursue economic growth must be balanced against the social costs of any potential reduction in services in some parts of the country – and the important role those services play in the long-term health of the economy.”

This is unfortunately and literally the extent to which Queensland is trying to counter the call for change and it is not enough. To be fair the post draft submission stage of the process was smack bang in the middle of our State Election with Queensland Treasury in caretaker mode.

However, if Queensland wants to maximise the likelihood that detrimental change does not occur then we need to better debunk the Commission’s proposals and highlight how they will affect our productivity and economic growth going forward. Queensland will lose to the greater good of lifting national productivity and economic growth if we are not proactive in countering states like Western Australia when they cite they are deliberately baulking on key reforms that drive economic activity because they are penalised GST payments in doing so.

By not countering the draft proposals with evidence and by not highlighting examples on how the Inquiry’s proposals would impact on our productivity and threaten our economic growth we run the risk of losing. Fortunately, it is not too late with a public hearing in Brisbane on the 5th of February.

Incidentally, the Victorian Government’s submission does an excellent job taking apart the Productivity Commission’s Report. Reading their submission, it becomes clear a major question is whether we radically change the HFE system to benefit Western Australia, noting that if we do we’re essentially forgiving them for poor budget management in the past and not saving for the future. Queensland and Victoria could and should work together in countering the Commission’s proposals as our interests (i.e. lost revenue) are generally aligned (see chart below).

Queensland can’t rely solely on a passionate State Treasurer appearing before the media throwing barbs at the federal government to advance our interests. We need the evidence and arguments to back up our opposition to change. If we don’t represent our interests in this manner we really only have ourselves to blame.

hfe_chart

Posted in Budget, Uncategorized | Tagged , , , , , | Leave a comment