
In my post last Thursday, I discussed Why Qld’s unemployment rate is highest in nation despite better jobs recovery during pandemic than rest of Australia. I noted a large part of the story was “Queensland’s strong recovery (and over-shooting) in the workforce participation rate, which is now 1.2 percentage points higher than it was in March, compared with a 0.3 percentage point increase nationwide”. At the moment, Queenslanders appear to feel more confident about looking for work than people in the rest of Australia. To understand better the relative importance of the change in the participation rate, I thought it might be useful to decompose the change in the unemployment rate since March into the contributions from changes in a) employment, b) the labour force participation rate, and c) civilian population aged 15 and over. This can be done by applying some basic calculus to the formula for the unemployment rate.* I’ve done this for Queensland, NSW, Victoria, and Australia and the results are presented in Table 1 below.
| Metrics | Qld | NSW | Vic. | Aus. |
| Unemployment rate in Dec-20) | 7.5% | 6.4% | 6.5% | 6.6% |
| Change since Mar-20 (% points) | 1.9% | 1.5% | 1.4% | 1.4% |
| Decomposition of change: | ||||
| Participation rate | 1.71% | 0.33% | -0.55% | 0.40% |
| Employment | -0.62% | 1.09% | 1.58% | 0.64% |
| Population | 0.79% | 0.09% | 0.35% | 0.35% |
The table shows how the percentage point change in the unemployment rate (e.g. 1.9% for Qld) since March can be broken down into the contributions from a higher participation rate (1.7%), higher employment (-0.6%), and higher population (0.8%). Because total employment (full-time + part-time) in the ABS Labour Force data for Queensland is now higher than it was in March, unlike in Australia as a whole, the change in employment subtracts from Queensland’s unemployment rate while it adds to it nationwide. The increase in the participation rate substantially increases Queensland’s unemployment rate by 1.7 percentage points, while the fall in Victoria’s participation rate supresses Victoria’s unemployment rate by over half a percentage point. You can also see that Queensland’s faster growing population, which requires our state economy to generate proportionately more jobs to keep up, is another factor that has added to the gap between our unemployment rate and those of other states.
Nationally, the largest contribution to the rise in the unemployment rate since March is the reduction in employment since March (0.6%), followed by the increase in the participation rate (0.4%), and population growth (0.3-0.4%).
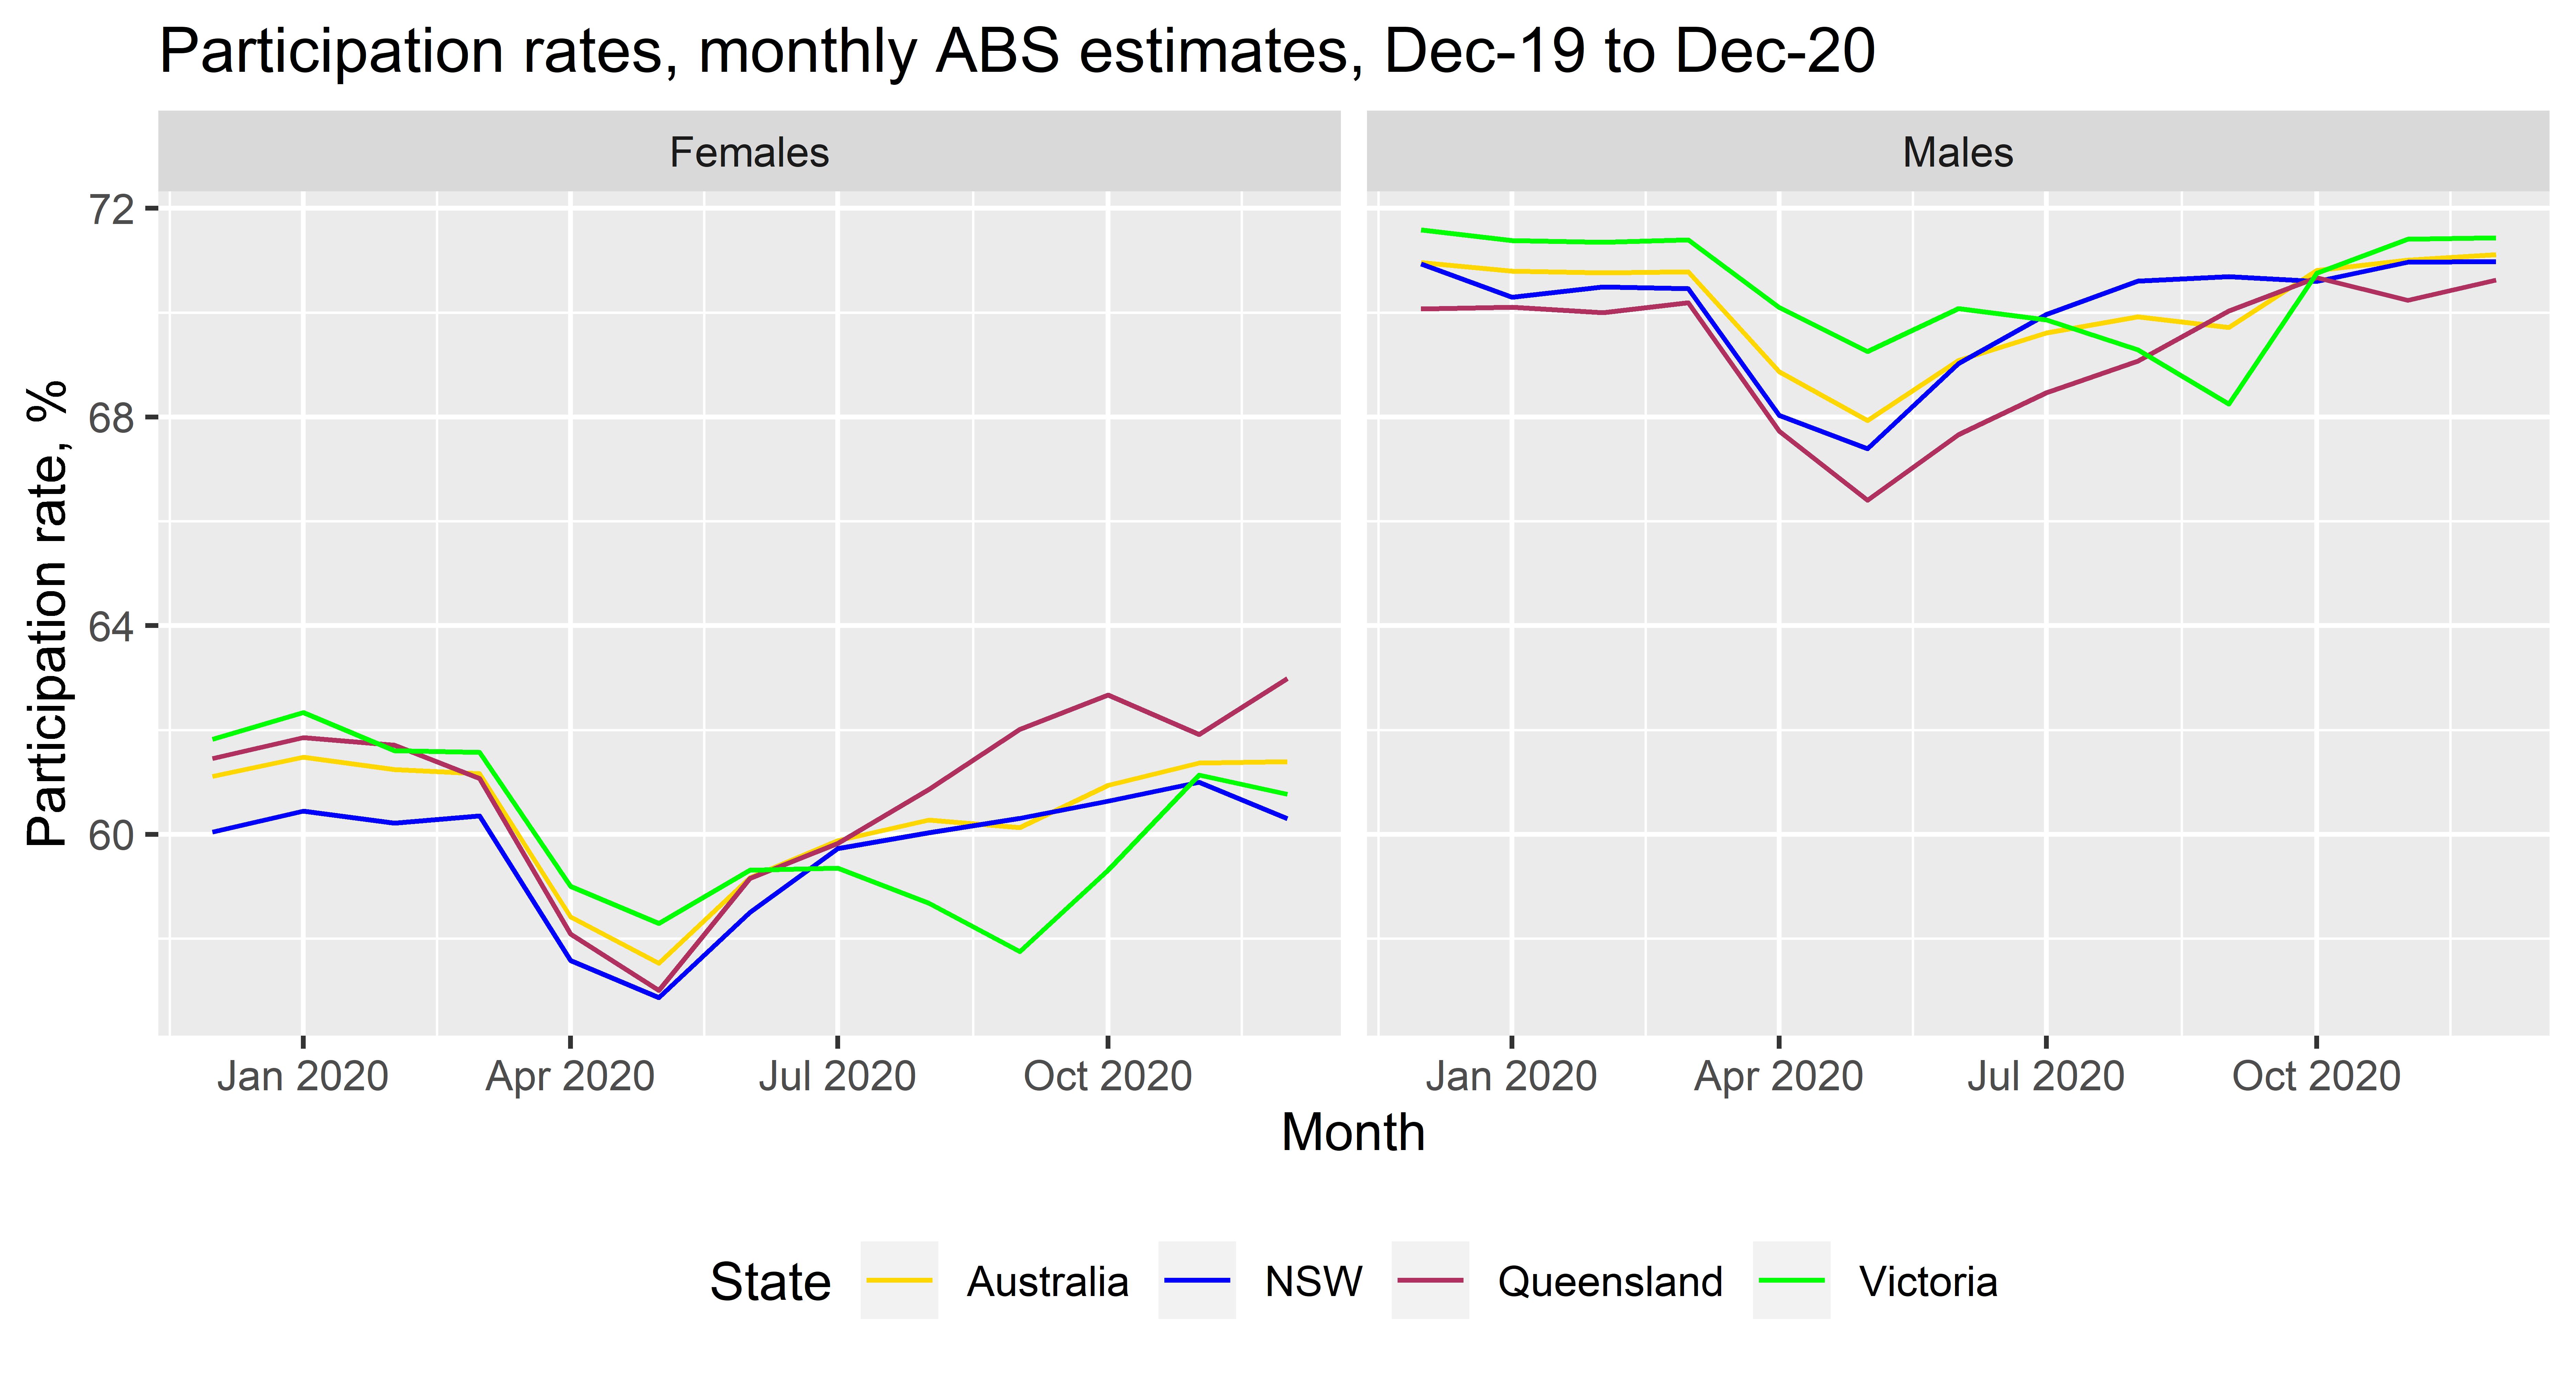
Finally, I should note that the participation rate may be higher now than in March due partly to an Added Worker effect, as pointed out by a perceptive reader in a comment on my post last Thursday. That is, part of the increase may be due to household members not previously participating in the workforce (e.g. stay-at-home mums) entering the workforce because another household member lost a job, had their hours reduced, or had a reduction in their business earnings. Suggestive of a possible Added Worker effect is the large increase in female workforce participation in Queensland in recent months (chart below). That said, I have no reason to suspect that the need for Added Workers in households is much greater in Queensland than in the rest of Australia at the moment, so my sense is that the stronger recovery in Queensland’s participation rate (relative to other states) signifies relatively higher confidence in the availability of jobs among Queensland women than among women in other states. This could partly be related to our ever-expanding state government workforce, which is predominantly female (69%), as former CCIQ Chief Economist Dr Marcus Smith pointed out in a LinkedIn post recently.
*Technical note: The unemployment rate (u) is the number of unemployed people (U) divided by the Labour Force (LF), which is the sum of U and total employed people (E) – i.e. LF = E + U. LF can also be calculated as the participation rate (pr) multiplied by the civilian population (P). It can hence also be expressed as u = (LF – E) / LF or
(pr . P – E) / (pr . P) which simplifies to u = 1 – (E / (pr. P)). Once u is expressed in this form, it’s straightforward to calculate the total differential of u with respect to the variables E, pr, and P. The calculus used is well-explained in Alpha Chiang’s classic text Fundamental Methods of Mathematical Economics, chapter 8.
Please feel free to comment below. Alternatively, you can email comments, questions, suggestions, or hot tips to contact@queenslandeconomywatch.com
