
The mini-boom in residential construction, of both inner Brisbane apartments and detached houses in outer-lying areas in SEQ, such as Ripley, Springfield and Yarrabilba, has been important to the economy over the last couple of years. This mini-boom now appears to be at (or possibly past) its peak. However, in his media release on the December quarter National Accounts, the Queensland Treasurer, referring to the robust growth in State Final Demand in December quarter, noted:
“This result shows an increase in household consumption drove the solid outcome in the December quarter and was backed up with construction of new dwellings which rose 1.1 per cent and total dwelling investment was 3.2 per cent higher over the year, reflecting the strong growth in construction work done on medium to high density dwellings.
“A strong pipeline of housing work yet to be done suggests ongoing strength in Queensland dwelling investment in 2016-17…”
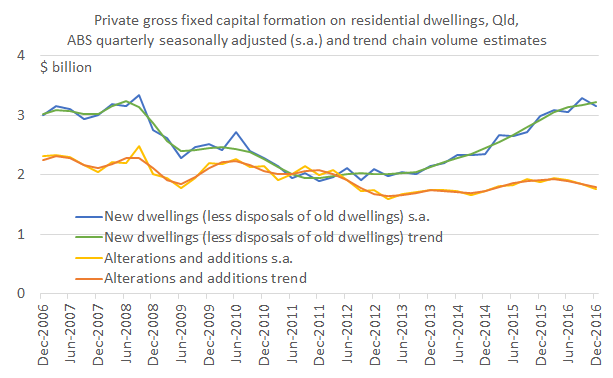
The Treasurer is correct that there is a strong pipeline of work yet to be done, but the December quarter growth statistics he cites are based on the smoothed backward looking ABS trend data, which can hide turning points that may be apparent in the (albeit noisier) seasonally adjusted data. According to the seasonally adjusted data, gross fixed capital formation (i.e. construction or renovation) of dwellings fell 4.2 percent in the December quarter (see chart below), suggesting we may have passed the peak of residential construction activity in this cycle.
So residential construction is no longer a driver of growth in the Queensland economy and I expect it will slightly detract from growth over the next year as it declines (moderately) from its recent peak. Based on the most recent National Accounts and exports data, I expect the major drivers of growth in the Queensland economy over the next year to be a reinvigorated resources sector, which is likely contributing to a noticeable pick up in investment in machinery and equipment (up 5.7% in December quarter) and, for better or worse, State Government capital works expenditure, which was a strong contributor to the growth in demand in the last quarter (see yesterday’s post).

Gene, Good post, although I wouldn’t be so keen to dismiss the Trend in favour of one quarter of seasonally adjusted data. While the Trend may be slower to detect turning points the seasonally adjusted data is also prone to suggesting turning points that never actually follow through. Just take a look at your chart where similar dips (or rallies) abound in the s.a. data that turned out to be mere blips, rather than turning points.
I think the Treasurer is justified in focusing his commentary on the Trend data…indeed in other instances we berate pollies when they choose, for political point scoring, to focus on the s.a. data despite ABS warnings not to do so.
There’ll never be a “right” answer to this question but we need to acknowledge that these indicators (whether s.a. or Trend) are always actually “estimates” and it’s the quality of the signal that we should be focused on.
Cheers, Pete
Yes, good point, Pete, which I don’t disagree with. There is a fair bit of noise in the s.a. data. My preference would be that the Treasury and the politicians use both the s.a. and trend data and come up with a viewpoint on the current state of the economy based on that, as well as other relevant data and information. I’m probably biased because in Commonwealth Treasury we focused on the s.a. data, but I acknowledge they are less noisy at the national level and the signal is better.