
Queensland is such a large and diverse state, with regional economies having vastly different drivers of growth (e.g. tourism in Cairns, mining in Mackay), that it’s often hard to get a sense of how different parts of the state are performing. Following Thursday’s data dump from the ABS, which among other things showed a strong pick up in interstate migration (see Qld the most popular state for interstate movers), I thought a visualisation of regional unemployment rates faceted by region might be revealing (Figure 1).
Figure 1. Queensland regional unemployment rates, Sep-99 to Aug-18,
12-month moving averages of ABS monthly estimates
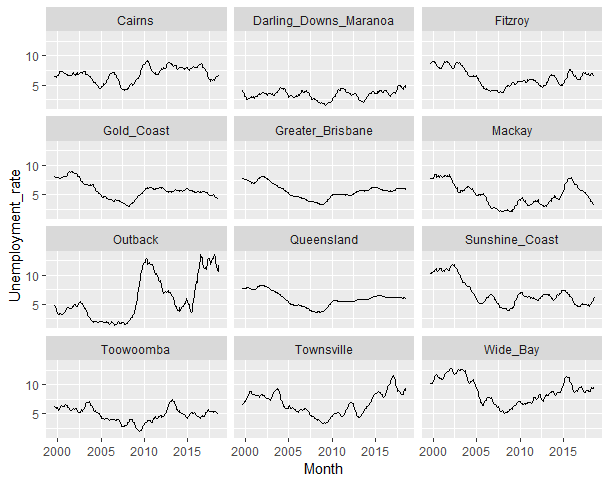
Unemployment remains very high in the usual places: the outback which has been suffering from the drought, my home town of Townsville which has shed a lot of manufacturing and heavy industry jobs in recent years (e.g. at Queensland Nickel), and Wide Bay, which has typically been short of economic opportunities and also seems to attract unemployed people due to its low cost of housing. The state’s lowest unemployment rate is in the Mackay region, which has been doing very nicely out of the recovery in coal prices and production that began in late 2016.
For additional information, see the Queensland Government Statistician’s Office’s regional labour force brief for August 2018.
For those interested, I produced Figure 1 using the ggplot2 package in R.
