
One of Queensland Deputy Premier-Treasurer Jackie Trad’s biggest challenges in her first state budget, to be delivered next month, is to demonstrate a credible debt reduction strategy. She needs to show how she can reduce state debt from its current level of $71 billion, or at least prevent it from blowing out to nearly $81 billion, as currently projected for 2020-21. In this regard, she will be helped by healthy royalty and payroll tax revenues, but she also has to cope with a fall in Queensland’s share of GST revenue and the legacy of the past debt build up, which costs the general government budget $1.5 billion in interest expenses each year.
When chatting with people about my forthcoming book Beautiful One Day, Broke the Next, to be published by Connor Court later this year, I am often asked how the state government accumulated so much debt. To answer this question, I analysed the cash flow statements of the Queensland government over 2006-07 to 2015-16, the ten year period in which total state debt increased by over $54 billion. I am looking at the whole Queensland government, including government-owned corporations (GOCs), because it’s the total debt figure that the rating agencies such as S&P and Moody’s focus on, and also because the lines between the general government sector and GOCs have been blurred in Queensland (see my post Qld state debt debate is challenging for both sides).
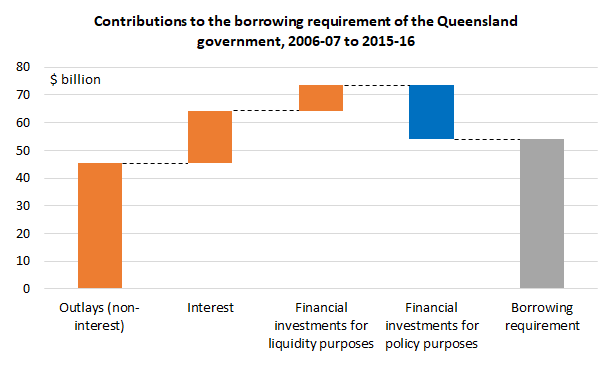
The main driver of the additional borrowing over the ten years to 2015-16 was capital outlays in excess of cash available. On its operating activities, the Queensland government, both general government and GOCs, ran cash surpluses over the period. But there were large cash deficits overall taking into account capital expenditure (see figure below). Also, adding to the total borrowing requirement were additional interest expenses incurred because of all the additional borrowing. This accounted for a substantial share (around 30%) of the cash deficits over the period. Note also:
- the state government’s commitment over most of this period to pre-funding some of its liabilities (e.g. defined benefit superannuation and long-service leave) added to the borrowing requirement (i.e. the block labelled “Financial investments for liquidity purposes”); and
- asset sales and leases (which are negative “Financial investments for policy purposes”), largely by the Bligh government in 2010 and 2011, substantially reduced the overall borrowing requirement.
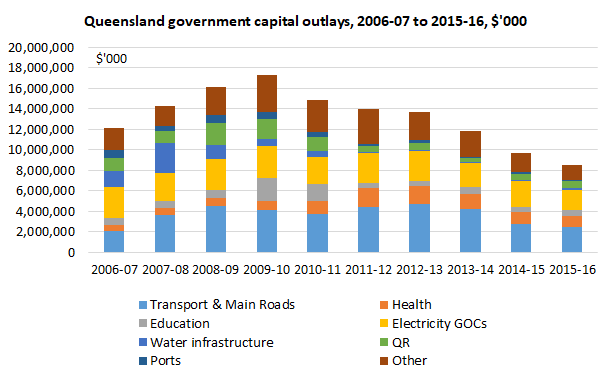
I noted above it was additional capital outlays that were to blame. What types of infrastructure were invested in? While the drought resilient infrastructure spending on dams and recycled water and desalination plants are often brought up, they were only a fraction of the total capital outlays over the period. Capital outlays were widely spread-e.g. there were large capital outlays on roadworks (see the figure below, based on my collation of data from the Queensland government’s capital works statements over the period). I should note the Australian government contributed to the funding of a significant amount of these capital works, e.g. Building the Education Revolution (BER) and natural disaster support, but the huge growth in capital outlays began in the late 2000s, before BER and the 2010-11 natural disasters.
Arguably, some of the additional capital outlays were necessary, as the Queensland economy and population had grown strongly in the 2000s, particularly due to the mining boom. In its 2015 Review of State Finances for the Palaszczuk government, the Queensland Treasury tried to look on the bright side of the debt build up:
Successive Queensland governments implemented policies aimed at raising service levels towards national standards in key areas and addressing infrastructure deficits. The benefit of that investment today (beyond the obvious service delivery benefits) is that Queensland is not facing the major infrastructure pressures now being experienced in many other states.
The Treasury also noted the imbalance between Queensland’s desire to be a low tax state and the need to provide a decent level of services. While the Treasury made some fair points, it was constrained by the necessity of it being seen as non-partisan, and it could not deliver much deserved criticism of the quality of Queensland government decision making in the mid-to-late 2000s, which is a major theme of my upcoming book. Needless to say, the quality of business case development and decision making in this crisis-prone period was substantially below par.
So where are we now? Queensland has a much higher state debt per capita than most other states and territories (see figure below). I am very much looking forward to Deputy Premier-Treasurer Trad’s debt reduction strategy in her first state budget. It’s not completely out of the question that Queensland could regain a AAA credit rating in the next five years, with strong budget management and with a continuation of favourable economic conditions. We wish the Deputy Premier-Treasurer well in this endeavour.

N.B. I have made some minor adjustments to this post since it was originally posted to make it clearer.

A good place for the Deputy Premier to start is consider embracing a 2018 version of former Treasurer Keith De Lacy’s “trilogy”:
1. No new or increased taxes.
2. Fully fund accruing liabilities such as public sector superannuation.
3. Only borrow for assets which can produce an income stream to service that debt.
Rigorous application of that trilogy of fiscal commitments between 1989 and early 1996 saw Queensland have zero net debt and an unassailable Triple A credit rating.
Thanks Michael. Yes indeed. I agree. I discuss the benefits of the trilogy in my forthcoming book.
Well said Michael!
Thanks Gene
I’ll look forward to the book. Have you also looked to see if there is still any off- balance sheet debt, such as was the case with PPPs like the Southbank Education and Training Precinct, which turned out to have an expensive form of financing without any transfer of demand risk.
Regards
Bob
Thanks Bob. Not yet but that’s an excellent suggestion. I may need to add an additional section to cover this issue.
It’s wrong to count GOC debt as an addition to general government debt. It’s like counting the debt on a 50 per cent owned investment property as an addition to your credit card debt. A more relevant measure is financial net worth which requires *subtracting* GOC equity from general government debt.
Thanks John. I accept it’s important to consider the assets side of the balance sheet. Regarding state government net financial worth, it is negative and is projected to continue deteriorating for both the general government and GOCs over the forward estimates.
Total borrowing/debt is important in my view because the rating agencies, rightly or wrongly, look at the ratio of total non-financial sector debt/revenue and also because we’ve fallen far short of best practice in GOC governance in Queensland. These businesses have been subject to substantial political interference from time to time and have invested in assets that have turned out to be very poor investments.
I’m not sure it is “wrong” to count GOC debt, if the GOG is partially owned by the State (as a major shareholder). Shouldn’t a proportion of the debt attributable to the State’s equity share be counted?
This is particularly the case as much of the debt held by GOCs is a direct consequence of poor investment decisions by the State in the first place (think over-invesment in the SEQ water grid, gold plating electricity distribution etc.) and is only off the State’s balance sheet due to accounting decisions made by the State (often unilaterally)?
It makes no sense to base investment decisions on the irrational beliefs* of discredited ratings agencies. Regaining the AAA rating would reduce borrowing costs by around 0.2 percentage points (with the benefit accruing gradually as debt is refinanced). That might add up to $150 million a year, which is much less than the amount foregone when GOCs are privatised at prices less than the NPV of future earnings.
As regards poor investments, that certainly happens in both the public and private sectors, but that hasn’t stopped most GOCs from being profitable.
* To be fair, since ratings agencies are supposed to care only about bondholders, they will rationally give AAA to entities that forgo any risky investments, even those with high returns. That’s a silly strategy which is why no businesses and few governments try to maintain AAA ratings these days. The AAA rating isn’t a mark of good management but of excess timidity.
“The Treasury also noted the imbalance between Queensland’s desire to be a low tax state and the need to provide a decent level of services.”
Is that just Treasury speak for successive Queensland Governments have lived beyond their means?