
I have previously been critical of the City of Brisbane Investment Corporation (CBIC), which is owned by the Brisbane City Council, but is becoming a significant property investor and developer, raising all sorts of questions about the risk it is exposing ratepayers to, the appropriate role for Councils in the economy, as well as potential probity risks (see this November 2014 post). Recently, the ALP’s unsuccessful 2016 Lord Mayoral candidate, Rod Harding, has asked similar questions about CBIC, including in this Courier-Mail opinion piece: Property speculation by Brisbane council a ‘risky’ use of ratepayer money.
It would surprise many Brisbane ratepayers that the Council, through CBIC’s subsidiary BrisDev Pty Ltd, is developing a 90-unit apartment complex at Toowong: Augustus Residences at 24-26 Augustus St (see this Brisbane Times report). With a huge supply of units already coming on to the market in Brisbane, this is a fine time for Council to get in on the action.
Certainly one wonders about the quality of investment decision making at CBIC. The 2017 Annual Report for the CBIC reveals property represents the largest share of total assets by value, but there is also a peculiarly high allocation of assets to low-yielding cash investments (i.e. investments in the short-term money market which earned CBIC a 2.5% return in 2016-17), and no apparent allocation to equities (Chart 1).
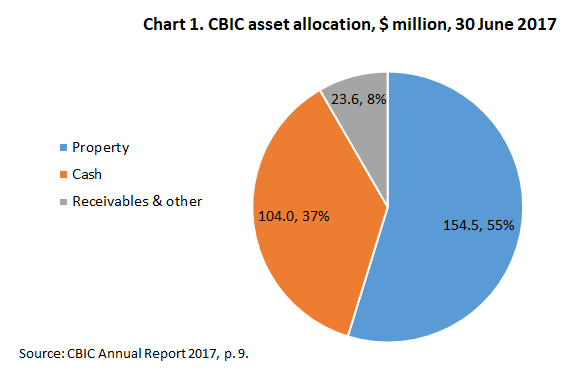
Contrast CBIC’s peculiar investment allocation with that of the highly diversified Australian Future Fund (Chart 2). The comparison is relevant because Brisbane Lord Mayor Graham Quirk has described CBIC as the city’s future fund. But a true future fund would be much more diversified, optimising the risk-return trade off, and avoiding such a heavy concentration in high risk property investment.
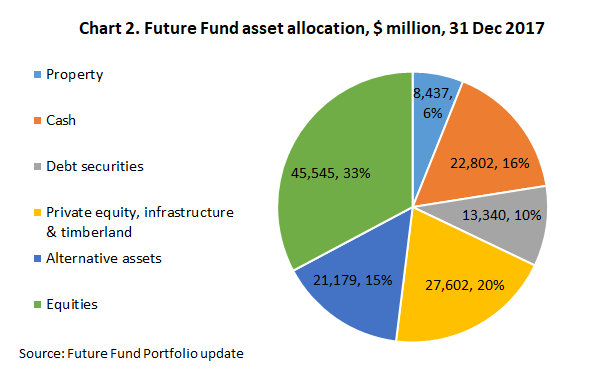
CBIC earned a return of 11.3% on its property investments and an overall 8.5% return in 2016-17. While this seems impressive, consider that the Australian Future Fund earns a similar rate of return, but with a much more diversified and less risky portfolio (see the Future Fund Portfolio Update). Over the last ten years, the Future Fund has earned an annual return of 8.1% p.a. on average and in 2017 it earned an 8.8% return.
Also, consider that part of the CBIC’s property investment return may be illusory, due to its close relationship with Council. It appears to be getting preferential access to properties owned by the Council, and it is also benefiting from leasing out space to the Council at many of its investment properties. The CBIC’s 2017 Annual Report, which I obtained a copy of thanks to the Council Opposition’s office, notes on p. 24:
CBIC has the ability to access surplus property assets within Council’s portfolio, which has enabled CBIC to maximise returns through development and further investment in these assets.
This statement makes me suspect that CBIC is obtaining Council properties at very favourable prices, and much more favourable than prices private developers would have to pay. So part of the return it earns could simply be a transfer of value from the Council to CBIC, as the Council has denied itself the higher prices that private developers may have paid, and CBIC benefits from having secured the properties at very favourable prices.
Looking at the income statement of CBIC, I see that a large share of its income comes from unrealised (fair value) capital gains on property assets (Table 1). So a large share of the $20 million dividend BCIC pays to Council is associated with unrealised capital gains, which to an extent may derive from the dubious process I have just speculated upon. That is, the dividend may be illusory, in part, as the Council is just getting back money it lost by not selling the properties at appropriate prices in the first place. I should also note companies should be cautious paying dividends out based on unrealised capital gains, which may not ultimately materialise.
Table 1. CBIC income statements
| 2017 ($M) | 2016 ($M) | |
| Income | ||
| Rental income | 11.0 | 8.3 |
| Interest | 5.3 | 3.5 |
| Distribution income | 0.4 | 0.3 |
| Fair value gains on property assets | 8.6 | 14.0 |
| Gain on sale of investments | 3.9 | 0.0 |
| Other income | 0.3 | 0.2 |
| Total income | 29.4 | 26.3 |
| Expenses | ||
| General and admin. expenses | 1.7 | 1.9 |
| Remuneration costs | 1.4 | 1.1 |
| Building expenditure | 2.8 | 3.4 |
| Loss on disposal of financial asset | 0.0 | 5.2 |
| Total expenses | 5.9 | 11.7 |
| Fair value gain/(loss) on equity investments (unrealised) | -0.5 | -0.9 |
| De-recognition of available for sale financial asset | 5.2 | |
| Total comprehensive income (i.e. profit) | 23.0 | 18.9 |
Source: CBIC 2017 Annual Report, p. 8.
In summary, CBIC, while still relatively small in the greater scheme of things, is creating unnecessary financial risks for BCC ratepayers by taking on property developments that should instead be undertaken by the private sector. A review of CBIC’s investments—and CBIC’s very reason for being—by independent experts is urgently required.
N.B. I would upload the CBIC’s Annual Report to my site if it weren’t such a huge file. Please get in touch with me if you’d really like a copy of it and I’ll see how I can get it to you.
