
My former Treasury colleague and old friend Joe Branigan, now at Cadence Economics and SMART Infrastructure Facility, was quick to tweet a State-of-Origin themed chart yesterday following the release of the NSW State Budget (see Joe’s chart below).
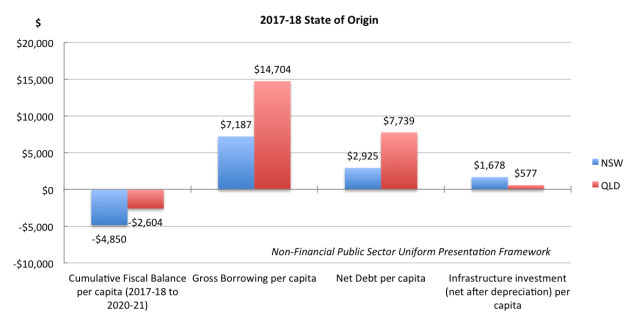
As noted in the budget papers, NSW is running “healthy surpluses” on its operating account, with a net operating balance forecast at an average of $2 billion over the budget forward estimates. Due to its privatisation program and healthy stamp duty receipts from a booming property market (which the NSW Treasury now expects to cool), NSW has been able to fund a massive infrastructure program, with (net) infrastructure investment per capita nearly three times higher in NSW than in Queensland, according to Joe’s calculations. NSW has been able to do this while keeping per capita debt figures under control and well below Queensland’s. (Note that, as a result of its large infrastructure program, NSW’s recorded fiscal deficits will be larger than Queensland’s over the forward estimates.)
In Queensland, with a State Government that is ideologically opposed to privatisation, and an Opposition that has given in to the public aversion to asset sales and has now ruled them out, there is little prospect of Queensland matching NSW’s record on infrastructure any time soon.

Unfortunately your analysis is spot on Gene. It is easy to forget that not long ago the NSW economy was a basket case and Qld was riding high on a resources boom.
Hopefully QLD can at least do better on the pitch!
Gene, whether or not the current state government is ideologically opposed to privatisation is a moot point. They won an election partly on instilling fear of that end so have a public who seem to think that is evil. Sensible privatisation of assets/entities that will generate a significant price and that will perform more cost effectively in the long term is very valid. But try telling the swinging voters that now. And, there are more swinging voters than previously.
Because One Nation is really a party of the 1940s they too will negate any moves this way when they (may) win a few seats in the next election.
Gene how do we get these graphs out into the public for more people to see, I think many who are currently ignorant would be shocked if they viewed these graphs, particularly the last two, debt per capita and infrastructure investment, they are some scary numbers.
Hi Glen, yes, those numbers certainly aren’t good. It would be good for them to have a wider audience. I’ll definitely keep covering these issues on my blog, and I’m always grateful to readers who share my posts via Facebook, Twitter, LinkedIn, etc.