
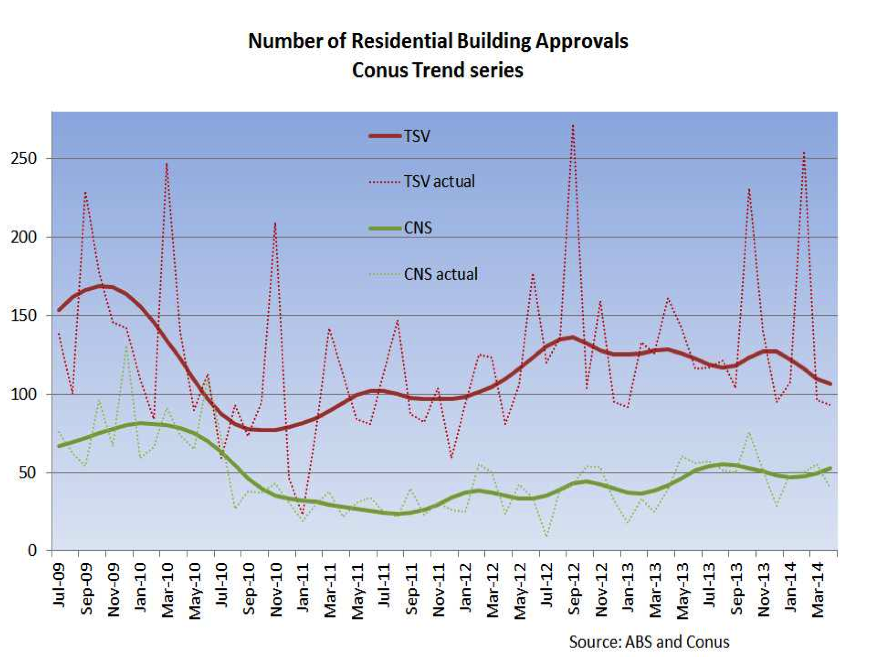
North and Far North Queensland have had lacklustre economies in the years since the financial crisis, with Cairns especially having suffered from the combined impact of the tourism downturn and an over-supply of properties due to a pre-financial crisis construction boom. Both Cairns and Townsville have unemployment rates higher than the State average, at 8.1% and 6.6% respectively compared with a State average of 6% (see Qld Treasury regional labour force information brief). Recent data unfortunately don’t give cause for great optimism that a strong recovery in the North is imminent. Last week, in his latest Conus Quarterly, Pete Faulkner presented a useful piece of analysis on trends in residential building approvals in Cairns and Townsville (see chart below). Pete notes: “We see trend approvals in Cairns on a slow upwardly trajectory (from very low levels); Townsville is drifting lower”.
 The prospects for Cairns appear much better than for Townsville over the longer-term, given Cairns’s superiority as a tourism destination. Local confidence in Cairns should be boosted significantly by the proposed $8 billion Aquis casino resort, which appears likely to proceed now a casino licence has been promised (see Cairns post report). Meanwhile, prospects for private sector investment don’t appear as bright in Townsville, and local MPs are banding together to lobby for Government funding for projects such as a Super Stadium for Townsville (see Townsville Bulletin report). Regrettably, but as is usually the case, the economic development of Townsville is seen as depending crucially on State and Federal Government investment.

How anyone can draw any inference about a positive trend in the Cairns construction industry from the dodgy trend line is beyond me. The ABS don’t produce a trend series at this scale for a very good reason (i.e. it will always be rubbish).
If you analyse the data a bit deeper, you come to the exact opposite conclusion – Townsville is travelling along a lot better than Cairns. 2011 Census data indicates both local government areas have about the same number of residential dwellings. But Townsville’s stock of dwellings is growing at about 2% per annum, while Cairns is a woeful 0.8%.
Sub 1% growth is not the sign of a recovery; it is an indication that the Cairns residential construction industry probably needs life support (not that any self respecting economist would suggest that). When the Cairns line in the graph has been substantially above the Townsville line for a few months, then the tradies in Cairns might have a reason to get a bit excited. Until then……..
Good points, Jim. Thanks for digging deeper. Yes, it would be difficult, if not impossible, to estimate a trend from that volatile local area data.