
The Queensland Government’s $10.2 billion capital program in 2017-18 is heavily skewed to regional areas outside SEQ and towards inner city Brisbane, but away from other areas in SEQ (see the chart below which I’ve created based on data in Tables 3 and 4 of Budget Paper 3 and extrapolations of ABS population data).
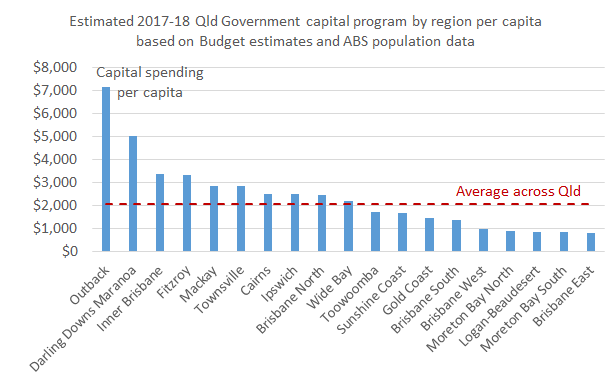
It would be good for future Budget papers to include analysis of regional per capita capital spending, explaining the reasons for any disparities. For example, the Government may be funding infrastructure to complement economic development in under-populated areas such as the Queensland outback and Darling Downs-Maranoa. But the large per capita funding differences between well-funded regions, such as Fitzroy and Inner Brisbane, and relatively poorly funded regions, such as Brisbane’s eastern, southern and western suburbs and Logan-Beaudesert among others, appear excessive to me.

Good post. I don’t understand why there isn’t more transparency around this. I suspect the “public bar wisdom” in most of the regions would be the reverse. Is it ok to repost your graph with a link?
Yes of course! Thanks
The “public bar wisdom” is indeed the opposite and not only that, but widely shared. This article should be in every regional paper and particularly pointed out to those who, believing the opposite, continually call for North Queensland to secede.
Thanks Phil, yes, the reality is vastly different from the perception.