
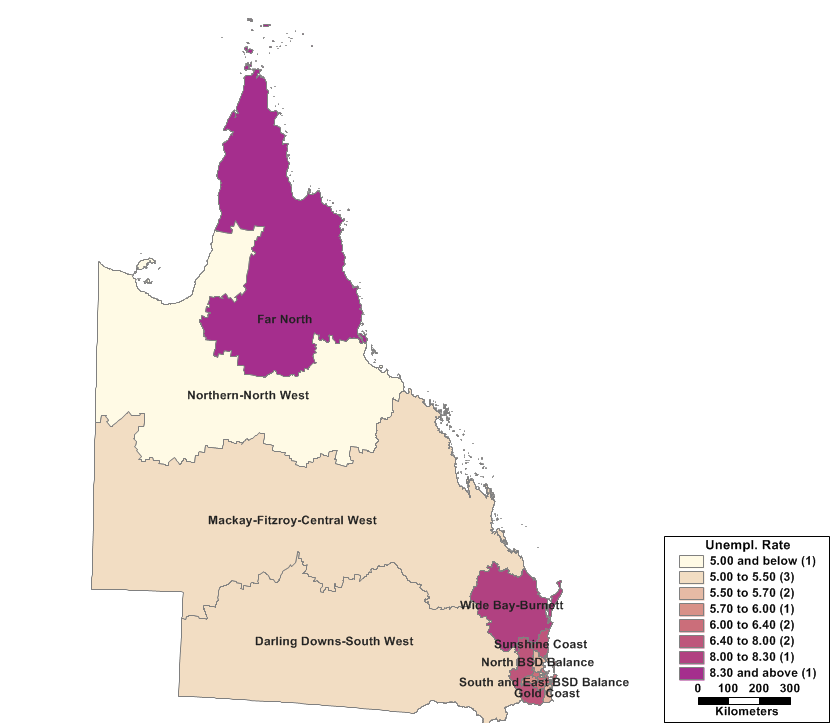
I’ve prepared some maps based on the ABS regional unemployment rate data released yesterday. I’ve taken the numbers from Queensland Treasury’s briefing on the data, which presents 12-month moving averages of the ABS data to smooth out the high degree of volatility in the data. Far North Queensland (FNQ) and Wide Bay-Burnett continue to have high unemployment rates relative to the State average. Here’s a map of the whole State:
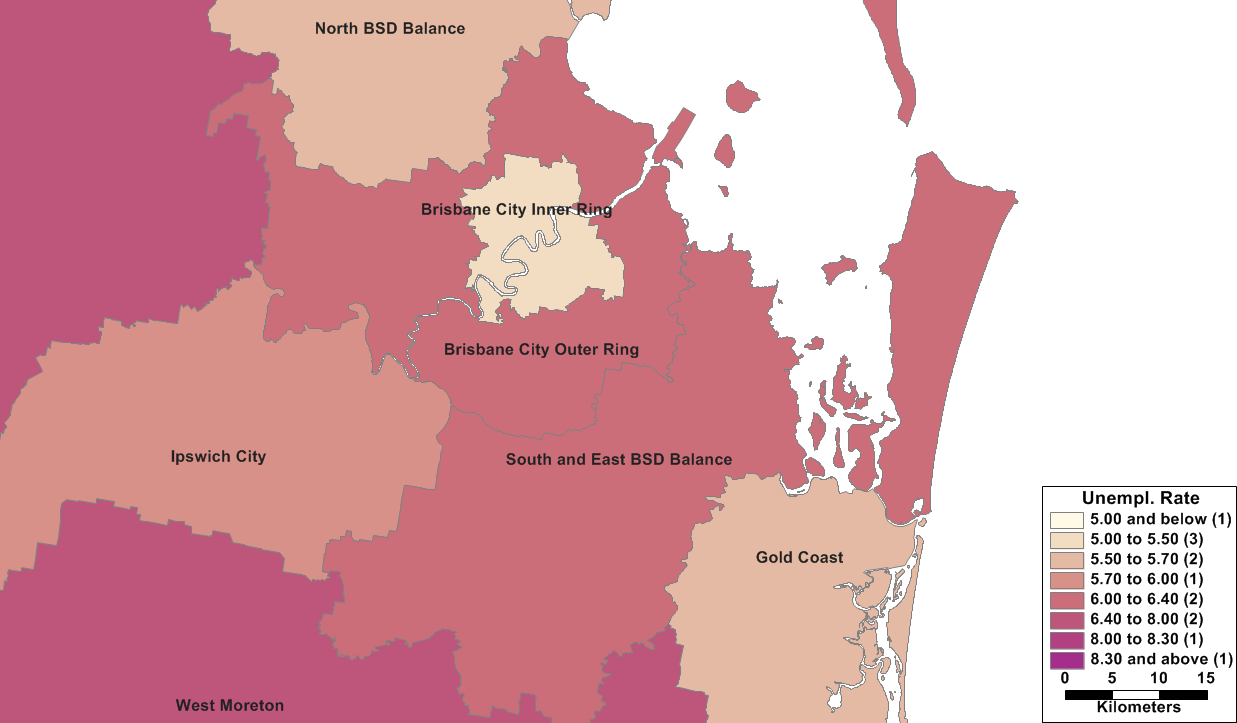
And here’s a close up of the Brisbane metro area:
FNQ bloggers Mark Beath and Pete Faulkner have been doing a great job trying to figure out what’s been going on with the extremely volatile FNQ data:
Pete’s analysis suggests the FNQ labour market has really improved a lot in recent months, and we should start to see this improvement in Treasury’s smoothed unemployment rate measure in the coming months.
