Huge upward revision in state debt – what’s going on?

We’re getting close to the point where we must respect the adage “no one ever kicks a dead dog” about the current Queensland state government. But it’s left itself open to criticism about its latest huge upward revision to state debt, well past what anyone would have expected.

You have to wonder how the rating agencies will interpret this. Will they start thinking about a credit rating downgrade? Also, you have to wonder how long the government has known about the debt blowout and whether it should have revealed it earlier. The figures that have been released to the Courier-Mail suggest big changes to the mid-year-update figures the government published four months ago. It can’t all be due to what is expected to happen in 2027-28, the new year which will be reported on in the coming budget.

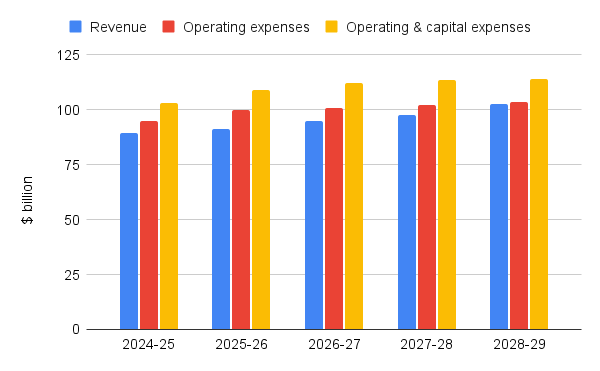
The Courier-Mail reports gross government debt will reach $188 billion by 30 June 2028. General government debt will reach $128 billion, and net debt will reach $73 billion (compared with only $15 billion in the general government sector in 2023-24).

In the December mid-year budget update, the government projected total debt of $149 billion by 30 June 2027. At the previous rate of debt increase, you might have expected them to end up with around $160-165 billion of debt by mid-2028, but now they’re revealing debt could be $188 billion. That’s a big acceleration in the rate of debt accumulation. What is going on?

From what I can tell, it’s a combination of:

  • huge vote-buying cost-of-living relief (e.g. electricity bill rebates) the government will offer in the upcoming budget;
  • infrastructure cost blowouts; and
  • the recent fall in coal prices (see chart below), which means the revenue upside I was hoping for in my previous post probably won’t occur – although I’d note the 12-month ahead futures price (12th position in the chart) has been much more stable than the price for contracts settling in the current month (1st position in the chart).

I accept state governments can get away with some debt to “borrow to build”, so to speak, but I will be very concerned if part of the debt surprise is borrowing for cost-of-living relief that gives us a net operating deficit. Borrowing to cover recurrent or operating expenses violates the so-called Golden Rule of Public Finance. You can read all about that, as well as about how everything started to go wrong during the Bligh government, in my 2018 book Beautiful One Day, Broke the Next.

Please feel free to comment below. Alternatively, you can email comments, questions, suggestions, or hot tips to contact@queenslandeconomywatch.com. Also, please check out my Economics Explored podcast, which has a new episode each week.

Posted in Budget | 1 Comment

Fossil fuels to figure in Qld’s future for decades to come

Despite the Queensland Government promoting the so-called Clean Economy, our state Treasury is still highly dependent on coal royalties, and the prosperity of our regional economies is highly correlated with coal mining. Coal prices remain at high levels and may deliver Treasurer Cameron Dick some additional budget billions if they don’t fall substantially by the end of the financial year (Figure 1).

On my calculations, coking coal prices have averaged around 300 USD/tonne this financial year to date, compared with the current state budget assumption of 241 USD/tonne over 2023-24. From the 2023-24 State Budget (Paper 2, p. 242), we know “A one per cent variation in the average price of export coal would lead to a change in royalty revenue of approximately $98 million.” If average coal prices remain around 25% above the assumed level for 2023-24, possibly too optimistic an assumption given the trajectory of the coal price, that would mean an additional $2.5 billion in coal royalties this financial year on top of the $9.2 billion already forecast. I will keep a close eye on this in the lead-up to the budget and provide further updates.

Of course, I need to acknowledge the broader context. There appears to be widespread support for decarbonisation in advanced economies, which would imply a very challenging adjustment for Queensland. However, coal (and gas) will likely remain important to the state economy for at least several decades. There are well-known facts about two-thirds to three-quarters of our coal exports being coking coal, essential for steel production for now, and how China and India keep building new coal-fired power plants. For example, according to Reuters, India is adding nearly 14 gigawatts of coal-fired capacity this year. Worldwide, coal consumption is 75% above what it was in 1992, the year of the Rio Earth Summit, which brought in the UN Framework Convention on Climate Change (Figure 2). Greta Thunberg was right that all the fine words of our leaders have amounted to nothing more than “Blah, Blah, Blah.” Consumption of coal is stabilising but is not yet plummeting as rapid decarbonisation advocates would like to see.

The other consideration is growing concerns that the transition to greener electricity will be rocky, with intermittent renewables making supply less reliable, for example. In my latest Economics Explored podcast interview, I spoke with Kansas City-based investment manager Ben Fraser of Aspen Funds, who is betting that the rocky energy transition will bolster demand for energy-dense, reliable fossil fuels. Ben argues:

“we’re at the early stages of an energy crisis that we haven’t seen in a long time. And it’s really going to be driven by a supply shortage of fossil fuels. As we’re making a transition into more green energy, renewable energy sources, that is really being driven by a political narrative that…at its worst is creating a huge gap of understanding of what it’s going to take to make this transition. And [we’re] really putting ourselves in a really bad position from a production and supply standpoint of fossil fuels over the next several decades that we believe is going to be pretty, pretty severe.” [at 14:55] 

“And so we really believe there’s a huge opportunity to get into fossil fuel production. So we’re investing a lot into these operating wells at really good prices.” [at 27:58]

This is not investment advice, but Ben’s thesis is very plausible. It’s probably safe to bet that the world will be reliant on Queensland’s coal for decades to come. And there are too many jobs at stake and too much money to be made, including for the state government, for it to shut down coal production in Queensland. 

This is not to deny we need to respond to climate change over the coming decades. But it probably won’t be by sharply cutting coal consumption anytime soon. Physicist Sabine Hossenfelder is probably right that, globally, we’ll have to undertake risky Climate Engineering as it will end up being the “cheapest way to get us out of this unfolding climate disaster”, as she puts it.


Please feel free to comment below. Alternatively, you can email comments, questions, suggestions, or hot tips to contact@queenslandeconomywatch.com. Also, please check out my Economics Explored podcast, which has a new episode each week.
Posted in Climate change, Mining | Tagged , , , , , | 2 Comments

How the Qld economy has changed in recent decades

The state and national economies have experienced similar trends by industry since 2000. The big changes have been the 2-3x increase in the mining sector’s importance since China’s economic growth started significantly influencing the global economy in the early-2000s (Figure 1). Because of the massive growth in mining in WA, too, the nationwide mining share has surged as well as that of the mining states. Services sectors such as health and professional, scientific and technical services have also expanded strongly relative to other sectors. 

Figure 1. Shares of total industry gross value added by industry division, 1989-90 to 2022-23

Source: ABS State Accounts, 2022-23. Note: shares are calculated using the current price data for each financial year. 

The expansion of services sectors has been assisted by an increase in the female workforce participation rate in recent decades, although the bulk of the increase was over the 1970s to 1990s. This trend has been offset partly by declining male participation (Figure 2). 

Figure 2. Labour force participation rates

Source: ABS Labour Force.

Also supporting the expansion of services sectors has been increasing levels of educational attainment (Figure 3). This has been a positive trend, but there are concerns over credentialism and people not using their tertiary education in their jobs. Also, given current skills shortages in construction, one wonders whether too many people have gotten university degrees rather than trade qualifications. 

Figure 3. Educational Attainment, Proportion of people 25+ who have at Least Completed Short-Cycle (at least 2 years) Tertiary, Australia

Source: World Bank, World Development Indicators.

Regarding mining, compare the growth of mining in Queensland with all industries in Figure 4, which shows chain volume or real (inflation-corrected) value-added estimates. This confirms the surge in mining is both a price and volume story. We’ve expanded our production substantially in recent decades and taken advantage of higher commodity prices at times.

Figure 4. Industry value added in mining versus all industries, Queensland, chain volume measures

Source: ABS State Accounts, 2022-23.

In contrast, Agriculture and manufacturing have declined in relative terms, and indeed manufacturing has flatlined in absolute terms since it peaked in the first decade of this century (Figure 5). Volatility in the agricultural sector makes it hard to discern the long-term trend, but arguably it is still positive. Part of the upward trend would be the shift to higher-value crops in many regions, such as macadamias replacing sugarcane on many fields in Bundaberg. 

Figure 5. Agriculture and manufacturing gross value added, chain volume (i.e. real) estimates

Source: ABS State Accounts, 2022-23.

Because of the disproportionate importance of mining in Queensland, it makes sense that some other sectors have contributions to the state economy lower than in the rest of Australia. All the shares have to add up to 100% after all. Financial services, ICT and professional, technical and scientific services have shares noticeably below those in the rest of Australia.

As I noted in the Queensland Future State report that I co-authored with Peter Faulkner for ANZ last year: 

“Historically, NSW and Victoria have been home to more corporate headquarters than Queensland and this has been reflected in proportionately more professional jobs based in southern states. ABS data on businesses by employment size and main state of operation show, at the end of the 2022 financial year, Queensland had 784 businesses with 200 or more employees, compared with 1,672 in NSW and 1,238 in Victoria. NSW had 2.1 times and Victoria had 1.6 times more large businesses than Queensland, even though they had only 1.5 and 1.2 times the population of Queensland, respectively.”

Luckily, we have a strong resources sector which helps compensate for any relative lack of vigour in other sectors. I’d like to see higher-valued services sectors increase their shares of the Queensland economy. Still, governments shouldn’t deliberately try to engineer that with activist industry policy. I think the best thing to do is to focus on improving our education system and aiming for as competitive a taxation system as possible. Thankfully, Queensland still has lower-than-average state taxation, but we lost our title as the lowest-taxing state during the Beattie years (see Julie Novak’s paper Queensland the low tax state). It would be good to aim for that title once again. 

To conclude, I have great optimism for Queensland in the future, but we can clearly do some things better, and there are short-term economic concerns, as I discussed in The Queensland Economy Post-Palaszczuk.

 Please feel free to comment below. Alternatively, you can email comments, questions, suggestions, or hot tips to contact@queenslandeconomywatch.com. Also, please check out my Economics Explored podcast, which has a new episode each week.
Posted in Budget, Macroeconomy, Tax | Tagged , , , , , | Leave a comment

How the Palaszczuk Gov’t Failed to Abide By Its Own Fiscal Principles | What it Means for the Miles Gov’t

The Palaszczuk Government breached its own self-imposed fiscal principles and had to introduce new weaker principles in 2021. The Queensland Government, now headed by Premier Miles but with the same Treasurer, is at risk of breaching two of its revised fiscal principles in coming years. 

Introduction

The Palaszczuk Government is now history, but its successor, the Miles Government, has to live with decisions made during Palaszczuk’s reign. Those decisions, particularly its failure to abide by its own fiscal principles, now limit the ability of the Miles Government to respond to various crises, owing to the ever-growing public debt interest bill, which is doubling from nearly $2 billion in 2023-24 to nearly $4 billion in 2026-27. The Treasury has to pay the bondholders first, and this money cannot be used to address health, housing, or youth justice crises. 

In the mid-2000s, just before the Beattie and Bligh Governments spent up big in response to various energy, water, and health crises, annual interest payments were around $200 million or $350 million in today’s dollars. Relative to revenue, in the early 2000s, interest payments were only 0.6% of revenue, compared with 2.3% in 2023-24 and a projected 4.5% in 2026-27. In this way, government debt reduces the government’s flexibility in responding to community needs. 

Performance against its original fiscal principles

Coming into office in February 2015, the Palaszczuk Government had originally aimed to reduce debt, specifically the general government debt-to-revenue ratio, but it gave up after it proved too hard. It made some early gains, largely by shifting a few billion dollars of debt onto state-owned energy businesses. And later, it benefited from the surge in coal prices since Russia invaded Ukraine in February 2022. However, it could not arrest the trend toward higher debt. General government debt to revenue is projected to reach 111% by 2026-27 (Figure 1). This compares with around 70% in 2015-16, the first full financial year of the Palaszczuk Government. Net debt (i.e. debt less liquid assets such as those managed by QIC) is projected to reach 54% of revenue by 2025-26 compared with only around 1% of revenue in 2015-16. The Government is right these debt figures are much better than figures for NSW and Victoria, but it cannot deny that it has set Queensland on a trajectory of ever-increasing debt. 

Figure 1. Queensland General Government gross and net debt to revenue ratios, %

Source: Queensland Budget Papers.  

The Palaszczuk Government failed to meet three original fiscal principles (Table 1). It was failing in its debt management principle even before the pandemic. For the other two failed principles, it could legitimately blame the pandemic.

Table 1. Palaszczuk Government performance against original principles 

PrincipleAssessment
1. Target ongoing reductions in Queensland’s relative debt burden, as measured by the General Government debt to revenue ratio.Failed even prior to the pandemic. The debt to revenue ratio was already increasing over the forward estimates prepared in 2019.
2. Target net operating surpluses that ensure any new capital investment in the General Government Sector is funded primarily through recurrent revenues rather than borrowing.Failed during the pandemic, but that was understandable, given the economic shock and the necessity of a fiscal response to some extent.
3. The capital program will be managed to ensure a consistent flow of works to support jobs and the economy and reduce the risk of backlogs emerging.No objective way of evaluating performance against this principle. 
4. Maintain competitive taxation by ensuring that General Government Sector own-source revenue remains at or below 8.5% of nominal gross state product, on average, across the forward estimates.The Government met this principle over the period it was in place. However, it could no longer keep it in the 2021-22 Budget due to soaring royalty revenue (e.g. own-source revenue was over 10% of GSP in 2022-23). 
5. Target full funding of long-term liabilities such as superannuation and WorkCover in accordance with actuarial advice.Met.
6. Maintain a sustainable public service by ensuring that overall growth in full–time equivalent (FTE) employees, on average over the forward estimates, does not exceed population growth [introduced in 2016-17].Failed during the pandemic. 

Source: Queensland Budget Papers and my assessment. 

The biggest failure of the Palaszczuk Government was its failure to keep its principle regarding debt, even before the pandemic. The government failed to meet its first fiscal principle to “Target ongoing reductions in Queensland’s relative debt burden, as measured by the general government debt to revenue ratio” before the pandemic. The 2019-20 Mid-Year Fiscal and Economic Review published in December 2019 projected (on p. 22) the General Government debt to revenue ratio to increase from 54% in 2018-19 to 78% in 2022-23. 

The Government could no longer credibly target “ongoing reductions in Queensland’s relative debt burden, as measured by the General Government debt to revenue ratio”. In its revised fiscal principles, discussed in the next section, it set what it may see as the much easier target of the stabilisation of net debt to revenue in the medium term and a reduction in net debt to revenue over the long term, presumably over 10 years or more–i.e. when it would no longer likely be in government and would not be held accountable. 

Furthermore, the Government had to abandon its public service growth principle, which it had breached and did not want to be constrained by in the future. In its last Budget using the previous principles (i.e. 2020-21), the Government noted (on p. 101): “The overall average annual growth rate over 2019-20 to 2023-24, based on current estimates, is 1.83%. This compares to an estimated Queensland population growth of 1¼ % annually.” Arguably, this breach of the principle was related to the slowing of population growth during the pandemic and the need to hire frontline health workers. 

Incidentally, since March 2015, Queensland public service full-time equivalent (FTE) numbers have increased by 22% compared with growth in Queensland’s population of 14% (Figure 2). Of course, the current Government would argue the difference is due largely to it having to restore public service numbers after the Newman Government. 

Figure 2. Queensland Government Public Service FTE numbers

Source: Queensland government workforce statistics, various issues. Note: data for some quarters have been interpolated given the relevant agency does not make reports for quarters prior to September 2019 available online, and they are available by request only. The data prior to September 2017 are from the author’s records and were used in his book “Beautiful One Day, Broke the Next.”

During the pandemic, the Palaszczuk Government could, temporarily, no longer target net operating surpluses or funding capital works largely with operating cash surpluses. However, that was understandable, given the economic shock. In the 2020-21 Budget (Paper 2, p. 16), the Government noted: “The COVID-19 pandemic has resulted in some of Queensland’s fiscal principles not being met, and appropriate revisions will be considered ahead of the 2021-22 Budget.” 

Finally, the Government had to modify the principle of keeping its own source revenue below 8.5% of GSP because of surging royalty revenues. This principle could have been better designed in the first place, and the new principle of keeping Queensland taxation per capita below the Australian average is arguably superior. This is a principle that Queensland Governments have easily met.

Performance against current fiscal principles

After revising its fiscal principles in 2021-22, because it failed to abide by its previous principles, the current Queensland Labor Government now appears at risk of failing on its revised debt and capital funding principles in future Budgets (Table 2). If it does not slow down the increase in net debt, it will arguably breach its new net debt stabilisation principle.  Also, it needs larger net operating surpluses in future to meet its capital funding principle.

Table 2. Palaszczuk Government performance against 2021-22 principles 

PrincipleAssessment
1. Stabilise the General Government Sector net debt to revenue ratio at sustainable levels in the medium term, and target reductions in the net debt to revenue ratio in the long term.Arguably the Government is at risk of breaching this. In the 2023-24 Budget (Paper 2, pp. 55-57), it argues the 54-55% figure in 2026-27 is “sustainable”, but we need to see its projections beyond 2026-27 as the trajectory so far is not encouraging (Figure 1). It may not end up stabilising the ratio at a sustainable level.NB. The Government does not define medium term anywhere, but it should refer to a period of around five years but less than ten years.   
2. Ensure that the average annual growth in General Government Sector expenditure in the medium term is below the average annual growth in General Government Sector revenue to deliver fiscally sustainable operating surpluses.Technically, the Government is breaching this principle, but this is because elevated royalty revenues are falling. From 2022-23 to 2026-27, revenue will fall an average of 0.6% per annum while expenses will increase 3.6% on average. The Government can be excused from temporarily breaching this principle because it relates to the expected moderation of royalty revenue. As the government argues, if royalties are excluded, it meets this principle. 
3. Target continual improvements in net operating surpluses to ensure that, in the medium term, net cash flows from investments in non-financial assets (capital) will be funded primarily from net cash inflows from operating activities. The capital program will focus on supporting a productive economy, jobs, and ensuring a pipeline of infrastructure that responds to population growth.There are modest improvements in the net operating balance over the forward estimates, from a deficit of $138 million in 2023-24 to a surplus of $621 million (or 0.1% of GSP) in 2026-27.But it would be hard for the Government to argue it is “primarily” funding capital spending with net operating cash flows. Chart 12 of the mid-year Budget Update for 2023-24 shows a 35% contribution in 2023-24, increasing to 47% contribution by 2026-27, whereas this should arguably be over 50% to qualify as “primarily”. The Government claims it meets the principle by calculating the contribution over five years (average of 66%) and including the big surplus year of 2022-23. But over the budget year and forward estimates (2023-24 to 2026-27), the average is only 39%.
4. Maintain competitive taxation by ensuring that, on a per capita basis, Queensland has lower taxation than the average of other states.Met. No risk of not meeting this principle.
5. Target the full funding of long-term liabilities such as superannuation and workers’ compensation in accordance with actuarial advice.Met. No risk of not meeting this principle, unless the Government withdraws further funds from schemes.

Source: Queensland Budget Papers and my assessment.  

In future Budgets, the Government is at significant risk of failing to meet its new debt principle, even though it is much weaker than the old principle. Queensland General Government net debt to revenue is currently projected to increase over the forward estimates (see Figure 1). Arguably, the government must take seriously its goal of stabilising net debt to revenue. It also needs to do better against its net operating balance and capital funding principle (principle 3), as discussed in Table 2.

Conclusion

Like the Bligh Government, the Palaszczuk Government, now the Miles Government, rejected the approach of sound public finance established by Treasurers of previous post-war state governments, including Keith DeLacy and Terry Mackenroth on the Labor side and Gordon Chalk and Tim Nicholls on the conservative side. The Government is now paying the consequences for its lack of fiscal discipline, as it needs to fund a sharply rising public debt interest bill while managing multiple crises in health, housing, and youth crime. 

Please feel free to comment below. Alternatively, you can email comments, questions, suggestions, or hot tips to contact@queenslandeconomywatch.com. Also, please check out my Economics Explored podcast, which has a new episode each week.
Posted in Budget | Tagged , | Leave a comment

The Queensland Economy Post-Palaszczuk

Summary

Given its strong potential, the Queensland economy should be doing much better than it is, particularly regarding its business and housing investment levels. Furthermore, the state has not had the rebound in manufacturing that Palaszczuk suggested at her final media conference. Besides health care and social assistance, mining has been Queensland’s stand-out industry, but it’s been in and out of favour with the government. There were some positive economic developments during Palaszczuk’s term, particularly the fall in the unemployment rate. Still, overall the record was disappointing, and some big challenges emerged in our former Premier’s final term. 

Introduction

It’s extraordinary how quickly the coup earlier this month against Annastacia Palaszczuk unfolded. She was at least equal to Beattie in political savvy and to Sir Joh in cunning. It’s still somewhat surprising that she’s now gone. That said, I recognise the state’s multiple crises in youth crime, housing and homelessness, and hospital ramping played a role in her downfall.   

What I found interesting about Palaszczuk’s resignation speech was her mention of economic issues. She correctly spoke about Queensland’s much lower unemployment rate than when she took office in February 2015 (Figure 1). Of course, that’s more to do with national economic factors, such as the strong nationwide recovery from the pandemic, than anything her government did. Also, Queensland’s unemployment rate is increasing faster than the national rate as the economy slows. In November, Queensland’s seasonally adjusted unemployment rate was 4.4% compared with 3.9% nationally.   

Has manufacturing been the success story Palaszczuk claimed?

One of the former Premier’s claims that surprised me related to the manufacturing sector. “We’ve started making things in Queensland again, like trains at Maryborough,” she said, according to the Brisbane Times. The suggested expansion in Queensland manufacturing is questionable. Queensland’s manufacturing sector has barely grown since 2015. In relative terms, it has declined. According to ABS estimates, it was only 1% larger in real terms in 2022-23 than in 2014-15, and it’s still below its peak in 2007-08 (Figure 2). Because manufacturing has treaded water while other sectors have expanded, its share of Queensland’s Gross State Product fell from 6.7% in 2014-15 to 5.4% in 2022-23.

The best Palaszczuk can claim is that despite the meagre growth in manufacturing (i.e. 1% vs 22% all-industries growth), Queensland has outperformed the rest of Australia. Nationwide, the manufacturing sector has shrunk by 0.8% since 2014-15 and is 10% below its peak in 2007-08, after which Australia’s car manufacturers started shutting down. 

The state government has not given mining the credit it deserves

Incidentally, besides health care, which was in the number one position, mining contributed the most to Queensland’s economic growth over the Palaszczuk Government period, increasing in real value-added terms by $11.1 billion or 17.7% between 2014-15 and 2022-23 (Figure 3). The strong upward trend is evident despite a decline over the last few years. I’m unsure exactly why mining gross value added peaked in real terms in 2019-20. Partly it may be due to the China ban on Australian thermal coal or a quirk of the ABS’s procedure for producing chain volume estimates. I’ll look into this further and provide an update if I can figure out exactly what’s happening. 

Given the hot-and-cold relationship between the state government and the sector, the government’s reliance on mining for economic vigour and strong royalty revenues is ironic. Former resources minister Anthony Lyneham was a very good minister, but he faced strong opposition to any new mining from the left of his party. To Palaszczuk’s credit, she eventually pushed through the Carmichael mine against formidable internal opposition. But she didn’t object to her Treasurer’s coal royalty hike. The unexpected colossal revenue grab was not good for business confidence in the stability of our policy settings. 

Queensland needs to lift business and housing investment urgently

Queensland needs a boost in private sector investment, which has been disappointing since 2015. The massive CAPEX associated with the Curtis Island LNG projects distorts the figures, but they still show private sector investment in Queensland has plateaued in Queensland in recent years (Figure 4). Despite an ever-growing population, the level of private sector investment is comparable to before the 2008 financial crisis–a decade and a half ago.

There have been concerns about private sector investment at a national level. Still, the rest of Australia has outperformed Queensland in recent years, particularly regarding business investment (Figure 5). For instance, over the five years to September quarter 2023, private sector capital investment (in real terms) increased by only 5.4% in Queensland compared with an 11.0% increase nationally. Given all the investment opportunities in Queensland in mining, energy, and other sectors, this is a disappointing performance. We should ask whether our regulatory policies discourage and block private sector investment. 

We need more business investment if we’re to realise our state’s economic potential and more dwelling investment if we’re to solve the housing crisis. Dwelling completions have been grossly insufficient, given record population growth in numerical terms (Figure 6). We were building nearly 50k new dwellings annually in the mid-nineties, but currently, we’re only managing 30-35k per annum. 

The short-term outlook is concerning

In a future post, I’ll have more to say on the short-term outlook (over the next 12 months). The question is whether the RBA can lock in the immaculate disinflation and avoid causing a national recession. However, as widely observed, it hasn’t avoided a per capita recession. For now, I’ll just note that the September quarter 2023 State Final Demand figure was a shocker, with Queensland being the only state to experience a contraction, due to declines in household consumption and private and public capital investment spending (Figure 7). As usual, I don’t want to overreact to one set of figures, so I will reserve any further commentary until I look closely at all the relevant data. 

Please feel free to comment below. Alternatively, you can email comments, questions, suggestions, or hot tips to contact@queenslandeconomywatch.com. Also, please check out my Economics Explored podcast, which has a new episode each week.

Posted in Industry policy, Macroeconomy | Tagged , , , , , | 2 Comments

Rookwood Weir illustrates how richer countries can better protect the environment

The nearly finished Rookwood Weir on the Fitzroy River in Central Queensland illustrates how wealthier countries can afford to look after the environment better than poorer countries. It is a good example of why calls for ‘degrowth’ should be rejected.

On Friday 20 October, I was fortunate enough to attend a site visit at Rookwood Weir hosted by Sunwater, the Queensland Government’s rural water business, which commissioned the weir. Check out Capricorn Enterprise’s write up of the site visit here: Rookwood Weir site visit | Capricorn Enterprise. The weir should be finished by the end of the year.  

Rookwood Weir site visit. I’m front row, centre. Thanks to Capricorn Enterprise for the photo and to Sunwater for hosting the excellent tour of the worksite. 

The day before I had presented on the economic outlook at the Capricorn Enterprise Major Projects Forum in Rockhampton. My presentation to the Forum is available here: Business Event Presentations | Capricorn Enterprise.  

At the Forum, Sunwater representative Jay Merritt gave an excellent presentation on the progress of the weir’s construction. Alas, it has run about $200 million over budget, a 55% overrun, so what was supposed to be a $367 million project is now a $568 million project (see Cost blow outs for Rookwood Weir). The Government has blamed the pandemic, the weather, and supply-chain disruptions for the huge cost overrun. So the economic viability of the project, already questionable according to the project’s business case, is even more in question, but we’ll put that to one side for this article. Of course, it’s taxpayers across the State who ultimately will pay for the cost overruns, and the project will no doubt help regional irrigators who are already preparing fields for new plantings of macadamias and other high-valued crops. 

What really fascinated me about Rookwood Weir were the extraordinary efforts Sunwater has undertaken to minimise the environmental impacts. The features that stood out to me were the fish lock and turtle movement ramp. The folks at Capricorn Enterprise have done a better job at describing these features than I could, so I’ll just quote them:

“Sunwater’s Jay Merritt hosted the tour and provided insights into the innovative engineering techniques that were used to build the weir, as well as the environmental safeguards developed to protect the river and its ecosystems. This includes the fish lock, a first-of-kind multi-level mechanical fish passage with features for effective fish attraction, and the turtle passage, supporting movement of six species, including critically endangered White-throated Snapping Turtle and vulnerable Fitzroy River turtle.”

These features have added a large undisclosed amount to the cost of the project, but are essential for allowing fish and turtles to move along the river. Sunwater is really concerned about the colony of turtles, and it has individually tagged hundreds of turtles to understand their movements (see Rookwood Weir turtle monitoring program to help protect local species – Sunwater). 

The turtle ramp appears well thought out, assuming it actually works, and it has several resting ponds for the turtles along the way, so they can break up their climb of the weir wall in times of low river flow (see the image below).

Turtle ramp with resting ponds at under construction Rookwood Weir. 

The fish lock and the turtle ramp at Rookwood Weir show the high willingness to pay for environmental protection in wealthy countries like Australia. Broadly speaking, wealthier countries have a higher willingness and ability to pay for environmental protection than poorer countries. This is one reason I disagree with the degrowth movement, which is pushing for large reductions in GDP and hence living standards as a way to avoid what it sees as the catastrophic threats of climate change and ecological collapse. Of course, countries with higher GDPs will generally have higher greenhouse gas emissions, even though emissions per dollar of GDP may be lower. We still need to decarbonise over coming decades, but richer countries are better placed to bear the costs of mitigation and to adapt to climate change. 

I recently summarised my thinking on degrowth in a paper for the Centre for Independent Studies (CIS), where I’m an adjunct fellow. The paper is titled Debunking Degrowth. As a classically liberal think tank, the CIS naturally would be opposed to degrowth, which would require authoritarian measures to implement. 

After the publication of my paper on degrowth, the CIS held an event at its Macquarie St HQ in Sydney on 26 September featuring a leading US economist, the so-called ‘Grumpy Economist’ Professor John Cochrane of the Hoover Institution, on the topic ‘Free to Grow.’ I interviewed John after his talk and moderated the Q&A session at the event. You can watch the whole thing on YouTube:

On degrowth, I had a good conversation with Oliver Hartwich from the New Zealand Initiative on its podcast, and I also published the audio on my own podcast: Growth or Degrowth? w/ Oliver Hartwich, NZ Initiative – EP208.

Please feel free to comment below. Alternatively, you can email comments, questions, suggestions, or hot tips to contact@queenslandeconomywatch.com. Also please check out my Economics Explored podcast, which has a new episode each week. 

Posted in Infrastructure | Tagged , , , , | 2 Comments

“Axis of evil” had good reasons to block Housing Australia Future Fund

I was stunned earlier this week when I heard the federal Greens had been accused of being in an “Axis of evil” with the Coalition in blocking the Housing Australia Future Fund (HAFF). Sure, the Greens’ call for rent controls is misguided, but the Greens’ central critique of the HAFF was sensible. If you’re actually going to invest in social housing, which is the Government’s intention, the HAFF looks like an ineffective and roundabout way of doing that. It requires the Government to borrow $10 billion to, as the Greens put it, gamble on the stockmarket, with the hope of generating a sufficient return to fund social housing.

Historical data on equity returns versus borrowing rates would suggest the Government could come out ahead in the long-term by following this strategy, but obviously it is risky and it’s silly to tie social housing funding to the outcomes of investments managed by the Future Fund, which would look after the HAFF’s funds. The strategy also couldn’t be used on a large scale because the more money the government tries to borrow, and hence the more bonds it needs to sell, the higher its borrowing costs as the market demands higher interest rates before it buy the additional bonds and lends the government more money. As a former Treasury official, I also hate the idea of the HAFF because setting up and running these types of funds absorbs the time of officials which could be better spent. And they complicate the task of public financial management. As Cameron Murray argued in a podcast conversation I had with him a few months ago, if the government wants to fund social housing it doesn’t need to set up the HAFF: Odd way to fix housing crisis proposed by Aus. Gov’t: invest in stocks first w/ Dr Cameron Murray, Sydney Uni.

In my view, the federal government misstepped by adopting this odd policy from the Grattan Institute. It looks like Prime Minister Alabanese had to take charge last week and announce a $2 billion Social Housing Accelerator, which was a real win for the Greens and acknowledgement the HAFF policy was a failure and really was not required after all.

On the Social Housing Accelerator, I should acknowledge here Graham Young’s blistering critique of it in an Australian Institute for Progress (AiP) newsletter Labor’s $2 Bn social housing policy inflationary and will result in fewer and less affordable dwellings, which I thought made a good point about the risk of crowding out other construction as social housing projects compete with other housing projects for resources.

Regrettably, there probably isn’t much the federal government can do on the supply-side in the short-term to fix the housing crisis. On the demand side, however, it has much more scope to do something. A major contributor to the current housing crisis is the record rate of net overseas migration, at 400,000 people in 2022-23. In my view, the government should tighten up the visa policy settings to give us a level of immigration that best balances the needs of industry and the broader community. At the moment, we seem to be prioritising the demands of industry for more migrant labour over the needs of the broader community.

Of course, we need to do more on the supply-side, too. In my recent podcast conversation with him on housing and immigration, Alan Kohler mentioned a really good idea worth considering from demographer Simon Kuestenmacher: that state governments could set housing development targets for local governments and tie grant funding to the achievement of those targets. As much as I loathe central planning and am generally supportive of some decentralisation, I think this idea is worth consideration given the magnitude of the housing crisis we are facing. Obviously the targets the state governments set would need to be much higher than current housing development levels across council areas. You can listen to my full conversation with Alan Kohler via this link: Immigration & Australia’s housing crisis.

Please feel free to comment below. Alternatively, you can email comments, questions, suggestions, or hot tips to contact@queenslandeconomywatch.com. Also please check out my Economics Explored podcast, which has a new episode each week.

Posted in Housing | Tagged , , , | Leave a comment

What’s the best measure of the Qld Gov’t budget balance? Net Operating Balance vs Fiscal Balance

On Tuesday night I was on a panel discussing the Queensland state budget at an Australian Taxpayers’ Alliance (ATA) event held at the Paddington Tavern. One of the points discussed was the spin regarding the biggest-ever surplus for Queensland of $12.3 billion in 2022-23, even though the Net Operating Balance, the budget balance favoured by the government and reported by the media, swings into a $2.2 billion deficit next financial year, which is the financial year the 2023-24 state budget is actually for (Figure 1). And, after that, there are only small surpluses projected over 2024-25 to 2026-27 for the Net Operating Balance. Furthermore, there is another measure of the budget balance, the Fiscal Balance, which tells a different story, of substantial budget deficits over the budget forward estimates.

At the event, among other issues, we considered which is the most appropriate measure of the budget balance, the net operating balance or the fiscal balance? 

The Net Operating Balance is the difference between revenue and expenses from transactions, that is operating expenses including wages and salaries and purchases of other goods and services. It also includes depreciation to account for the consumption of capital goods (e.g. from wear and tear) in the current period. 

In contrast, the Fiscal Balance includes all current period capital expenditures in its calculation, not just depreciation. It is calculated as the Net Operating Balance less Net Acquisition of Non-financial Assets (i.e. which is more-or-less total capital spending less depreciation). Because the Net Acquistion of Non-financial Assets is typically positive, the Fiscal Balance is generally lower than the Net Operating Balance. For example, in 2022-23, Queensland’s Net Operating Balance is expected to be $12.3 billion, but the Fiscal Balance is expected to be $6.8 billion, because net capital expenditures are expected to be around $5.5 billion. 

At the event, I said that from the perspective of judging the state government’s impact on aggregate demand and potentially inflation, as well as understanding the government’s need to borrow and accumulate debt, the Fiscal Balance is the most appropriate budget balance measure. ATA Chief Economist John Humphreys also expressed his preference for the Fiscal Balance over the Net Operating Balance, given it’s the closest to the underlying cash balance which is the preferred measure of the federal government’s budget balance. 

Over the budget year and forward estimates, from 2023-24 to 2026-27, fiscal deficits (i.e. Fiscal Balance deficits) are expected to total $25 billion. Incidentally, over this period, general government gross debt will increase by $40 billion and net debt will increase by $41 billion. Debt increases by more than these fiscal deficits because the Queensland Government is borrowing so it can make equity contributions to government-owned businesses building renewable energy assets under the Queensland Energy and Jobs Plan. These equity injections are not considered transactions in goods or services and hence do not affect either of the budget balances. But they do create an additional need to borrow and hence the total increase in debt exceeds the total fiscal deficits.  

All this is not to say that the Net Operating Balance is an unimportant measure. It tells us whether the government is doing the bare minimum for fiscal sustainability. The Golden Rule of Public Finance is not to borrow to cover operating expenses. That is, a government should aim to at least balance or run a Net Operating surplus. This should be interpreted as a rule applicable over the business cycle rather than in any single year, so governments don’t end up running perverse fiscal policies, cutting operating expenses when they are confronted with declining revenues in a recession, for example. 

As long as it is running a Net Operating surplus or balaning the operating budget, a government can get away with a fiscal deficit to an extent. After all, the economy and government revenues expand over time. Depending on average interest rates and average growth rates, there is a fiscal deficit as a percentage of Gross State Product (GSP) that is compatible with a stable debt-to-GSP ratio. I’m referrring to GSP rather than GDP here because I’m talking about the state government, but the same principle applies for the federal government. Intuitively, it can make sense for governments to “borrow to build”, so to speak, borrowing to invest in capital expenditures that will benefit the community for years to come, rather than requiring them to be financed out of current revenues and compromising the delivery of government services in the current period. 

Whether a particular series of fiscal deficits are acceptable or not depends partly on your view on the ROI from current government capital expenditures. If they don’t help expand the economy and the government’s revenue raising capacity, they may not be good investments. They won’t be helping to pay for themselves over time. One of my fellow panellists on Tuesday, David Goodwin, argued vigorously that much of current government capital spending, on Olympics infrastructure and renewable energy, was a waste of money and would not deliver an ROI to Queensland. This issue is beyond the scope of this post, but I’ll aim to return to it in a future post. 

To summarise, from the point of view of fiscal sustainability, we need to consider the Fiscal Balance, which for Queensland is pointing to rapidly increasing gross and net debt levels. The Government’s preferred debt measure, general government net debt, is projected to surge from around $6 billion currently to $47 billion by mid-2027, an 8X increase. Gross debt will increase to $95 billion for the general government and to $147 billion for the Non-financial Public Sector, which is the general government and government-owned trading enterprises combined. 

You can watch a replay of the ATA Queensland budget panel discussion and Q&A on Facebook via the link below. 

https://fb.watch/ljiPXLujzb/

Please feel free to comment below. Alternatively, you can email comments, questions, suggestions, or hot tips to contact@queenslandeconomywatch.com. Also please check out my Economics Explored podcast, which has a new episode each week.

Posted in Budget | Tagged , , , | Leave a comment

Over half of Qld Budget’s $60bn of revenue upgrades used for additional spending over FY21 to FY24

Queensland general government revenues are $60 billion higher than once expected over 2020-21 to 2023-24, but debt is only $23 billion lower, with total spending revised up by around $32 billion. Some of this is understandable due to higher inflation and population growth, but much of it is due to policy choices, such as power price rebates. 

Since the current Queensland Treasurer’s first budget handed down in December 2020, estimates of total general government revenue across 2020-21 to 2023-24 have been revised upwards by $60 billion. The 2020-21 to 2023-24 time period is relevant because these were the four financial years forecast in the Treasurer’s first budget. Revenues have been higher than first expected because the economic recovery from the COVID-recession was much stronger than expected, meaning higher payroll tax and stamp duty revenues, and because of super-high commodity prices, primarily coal but to a lesser extent oil and gas, associated with the invasion of Ukraine. Partly, the revenue revisions were associated with the Government’s new royalty regime which imposed additional tiers of royalty rates.

At the time of the 2020-21 budget, Queensland general government debt was projected to increase to over $88 billion in 2023-24 and the total non-financial public sector was projected to increase to $130 billion. The non-financial public sector excludes state-owned financial corporations such as Queensland Treasury Corporation and Queensland Investment Corporation. Such entities can hold substantial amounts of debt unassociated with the usual business of government or traditional government trading enterprises. For instance, as well as borrowing money for the general government, QTC borrows additional money and lends it to local governments, universities, and private schools, among others.  

Thankfully, higher revenues since the 2020-21 budget have resulted in lower estimates of government debt in 2023-24, but not by as much as might be expected. Let’s consider the general government sector and I’ll aim to examine the total non-financial public sector including the government-owned corporations in a future article. The state Treasury is now forecasting debt levels of $65 billion for the general government and $111 billion for the non-financial public sector in 2023-24. For the general government sector, total debt is only $23 billion lower, despite $60 billion of revenue upgrades. What’s going on? 

Since the 2020-21 budget, total operating expenses over 2020-21 to 2023-24 have been revised upwards by around $30 billion, and capital expenses have been revised upwards by nearly $2 billion, meaning around $32 billion of additional spending. Around $14 billion of these additional expenses could be explained by higher inflation, average wages growth, and population on my calculations, which leaves over half of the increase in expenses due to explicit government policy decisions.  

Overall, we have accounted for $55 billion of the $60 billion of revenue revisions over 2020-21 to 2023-24: i.e. lower debt of $23 billion, higher spending of $32 billion. The remaining $5 billion could be explained by the government pre-borrowing money – that is, the government did not reduce its borrowing to the full extent its additional revenue would have allowed. There is also the tricky issue of the operating statement figures I’m quoting being accrual accounting estimates rather than cash estimates, and ultimately it’s the cash balances of the government that drive the borrowing requirements. I’ll aim to have an analysis of the cash flow statement which is also published in the budget in a future post. 

Finally, I should note that because the government is projected to run a total of over $25 billion of fiscal deficits over 2023-24 to 2026-27, total debt will continue to rise, and is expected to reach $95 billion for general government and $147 billion for the non-financial public sector in 2026-27.

I’ll be sharing more of my views on the Queensland budget and economy at an Australian Taxpayers’ Alliance event at the Paddington Tavern tomorrow night (Tuesday 20 June 2023). You can book tickets via:

Queensland’s State of the Economy

Please feel free to comment below. Alternatively, you can email comments, questions, suggestions, or hot tips to contact@queenslandeconomywatch.com. Also please check out my Economics Explored podcast, which has a new episode each week.

Posted in Budget | Tagged , , , | Leave a comment

Stopping poor infrastructure spending & pork barreling w/ Nicholas Gruen

Around the corner from my Brunswick St office, at the RNA showgrounds, work is underway on the Exhibition station upgrade so it’s ready for Cross River Rail, Brisbane’s new subway system. This appears to have necessitated traffic control on Gregory Terrace, the latest of many disruptions associated with the mega project. With all the disruptions, cost blowouts, and the possibility public transport usage won’t recover to its pre-COVID trajectory–it’s now at only 80-90% of pre-pandemic levels according to the Brisbane Times–it’s legitimate to question whether Cross River Rail was a good investment of public funds. It’s looking more likely the critics were right about the project, which could ultimately cost in the order of $10 billion. 

As questionable a project as Cross River Rail is, at least it’s not as bad as the $100 billion Melbourne suburban rail loop the Victorian Government green-lighted and which is receiving billions in federal funding, despite the state government not submitting a business case to Infrastructure Australia (see Daniel Andrews’ Suburban Rail Loop proceeds without business case). 

Clearly we can do better in infrastructure decision making across Australia, and one positive step toward that was suggested by Allegra Spender and her fellow Teal MPs last month when they proposed to legislate for compulsory disclosure of estimated costs and benefits of any major project proposed for Infrastructure Australia’s priority list (see Allegra Spender’s tweet below). This seemed eminently sensible to me, so I was aghast it was knocked back by a Government-Opposition team up. Both major parties have a mutual interest in continuing the current system which provides insufficient protections against pork barreling it seems.

This inglourious episode in national politics prompted a conversation between me and Nicholas Gruen on our new Policy Provocations podcast (see the YouTube video above). Nicholas’s big idea, which he applies in a wide range of public policy areas, is to use the wisdom of crowds to get better public policy outcomes. He thinks randomly-selected citizen’s juries or panels could help us make better infrastructure decisions and I agree. 

At the time Cross River Rail was being advanced, multiple experts were questioning the net benefits of the project and it would have been good to convene a public forum or citizens’ jury of some kind to elicit a wide range of perspectives and to subject the project to real scrutiny. Given the projected strong growth of SEQ, it may well make sense to build something like Cross River Rail one day, but I am sceptical regarding whether we need it now. Given Queensland’s various health, youth crime, and housing crises, there are arguably more important priorities. 

Please feel free to comment below. Alternatively, you can email comments, questions, suggestions, or hot tips to contact@queenslandeconomywatch.com. Also please check out my Economics Explored podcast, which has a new episode each week.

Posted in Budget, Infrastructure | Tagged , , | 1 Comment