
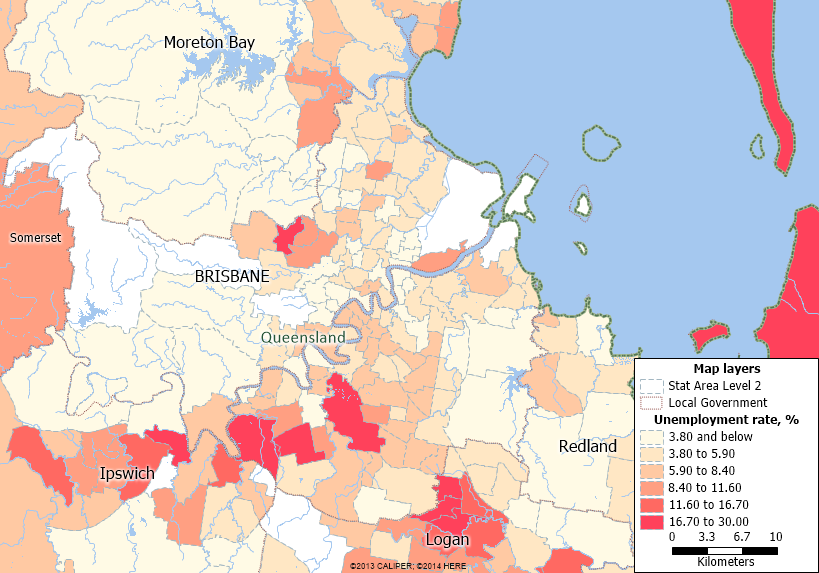
I’ve produced the map of unemployment rates for local areas in the Brisbane metro area below based on the latest small area labour markets data for March 2015 from the federal Department of Employment. The data show that pockets of very high unemployment continue to exist in Logan, Brisbane’s South West and Ipswich (e.g. unemployment rates of nearly 25% in Logan Central, over 21% in Wacol, and over 18% in Riverview in Ipswich). Unemployment has fallen from even higher rates in the middle of last year in Brisbane’s South West and Ipswich, but unemployment in Logan has continued to increase. I suspect there is a combination of factors behind Logan’s very high unemployment, including its distance from areas with better employment opportunities, which may be difficult to access via public transport from Logan, and a relatively disadvantaged population with low education and literacy levels.
Pete Faulkner has posted on the small area labour markets data for North and Far North Queensland:
Small Area Labour Market data supports improving jobs story in Q1 for Far North
