
The volatile labour force data yielded a nice surprise for the Queensland Government today, with the seasonally adjusted rate falling from 6.8% to 6.1% between November and December last year, and the trend rate falling marginally, too, though staying the same rounded to one decimal place at 6.6% (see chart below).

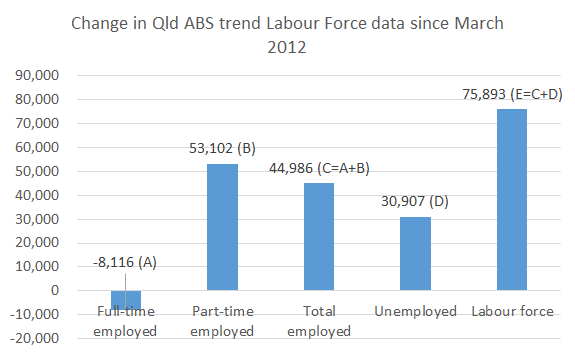
While today’s numbers are good news for the Government, it is still vulnerable to the criticism that the growth in employment during its first term was all part-time, and full-time employment (in trend terms) appears to have fallen (see chart below). While the seasonally adjusted data showed an unbelievably large growth in full-time employment in December, the seasonally adjusted data nonetheless showed the bulk of jobs growth over the Government’s first term was part-time – around 6,000 additional full-time jobs and 52,000 additional part-time jobs since March 2012.
Pete Faulkner has a very good post on the surprising labour force data:

Gene
This is welcome news.
The labour force data is alway pretty volatile. When you have a look at the numbers from the ABS a bit deeper, the big driver of employment was growth in full time female jobs in December (up a whopping 31,000 in a month on a seasonally adjusted basis, but only 3,000 on a trend basis).
You might reasonably expect a bit of a jump in the retail sector for that demographic in December. But that big?
I suspect we may see a revision of the figure at some date in the future as this is by far the biggest monthly change (+ or -) in the series (since 1978). Also, there is rarely a difference of more than 1.5% between the numbers in the seasonably adjusted and trend series (i.e. they pretty closely track together as you would expect). The difference is over 3% at the moment (again pointing to an anomaly in the data). I’m not sure why there would be such a big discrepancy all of a sudden. Perhaps due to the rotation of the survey sample?
Yes, I suspect much of it’s due to sample rotation. But I’d like to be wrong and for the economy to really be recovering strongly. I’m just a bit doubtful given the level of business confidence.
I agree with Jim- good news for Qld and it’s about time we had some
Absolutely, thanks for the comment, KT.